
Chinese Bulletin of Botany ›› 2024, Vol. 59 ›› Issue (6): 1041-1053.DOI: 10.11983/CBB24087 cstr: 32102.14.CBB24087
Special Issue: 玉米生物学与分子设计(2024年59卷6期)
• RESEARCH PAPERS • Previous Articles Next Articles
Yuan Li1, Kaijian Fan1, Tai An2, Cong Li3, Junxia Jiang1, Hao Niu1, Weiwei Zeng2, Yanfang Heng1, Hu Li1, Junjie Fu1, Huihui Li1, Liang Li1,*( )
)
Received:2024-06-06
Accepted:2024-10-14
Online:2024-11-10
Published:2024-10-16
Contact:
*E-mail: liliang05@caas.cn
Yuan Li, Kaijian Fan, Tai An, Cong Li, Junxia Jiang, Hao Niu, Weiwei Zeng, Yanfang Heng, Hu Li, Junjie Fu, Huihui Li, Liang Li. Study on Multi-environment Genome-wide Prediction of Inbred Agronomic Traits in Maize Natural Populations[J]. Chinese Bulletin of Botany, 2024, 59(6): 1041-1053.
| Trait | Abbreviate | Unit | Description |
|---|---|---|---|
| Days to anthesis | DTA | Days | Recorded the number of days from the planting day to anthesis data when 50% of the plant anthers in the plot were extruded to 1/2 length of the main tassel spindle |
| Plant height | PH | cm | Measured the height of the stem from the ground to the top of the tassel of 3-5 plants |
| Ear height | EH | cm | Measured the height of the stem from the ground to the base of the ear of 3-5 plants |
| Ear length | EL | cm | Measured the length of 3-5 ears |
| Ear row number | ERN | Count | Counted the number of ear row of 3-5 ears |
| Kernel number per row | KNR | Count | Counted the number of kernels per row of 3-5 ears |
Table 1 General information of six maize agronomic traits for 244 inbred lines
| Trait | Abbreviate | Unit | Description |
|---|---|---|---|
| Days to anthesis | DTA | Days | Recorded the number of days from the planting day to anthesis data when 50% of the plant anthers in the plot were extruded to 1/2 length of the main tassel spindle |
| Plant height | PH | cm | Measured the height of the stem from the ground to the top of the tassel of 3-5 plants |
| Ear height | EH | cm | Measured the height of the stem from the ground to the base of the ear of 3-5 plants |
| Ear length | EL | cm | Measured the length of 3-5 ears |
| Ear row number | ERN | Count | Counted the number of ear row of 3-5 ears |
| Kernel number per row | KNR | Count | Counted the number of kernels per row of 3-5 ears |
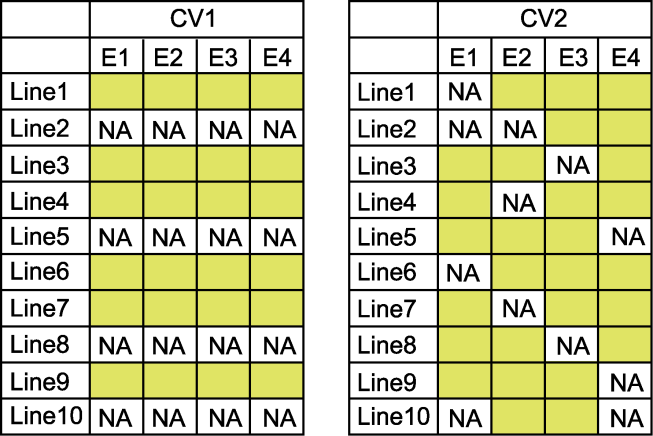
Figure 1 Two distinct cross-validation schemes (CV1 and CV2) In the table, E1-E4 indicate different environments, NA indicate that the variety phenotype was untested in this environment, and the yellow space indicate that the variety phenotype tested in this environment.
| Trait | Environment | Range | Means±SD | Skew | Kurt | Coefficient of variation (%) |
|---|---|---|---|---|---|---|
| DTA | 22BJ | 48.00-72.00 | 61.41±15.29 | -0.56 | 0.11 | 0.25 |
| 22MS | 54.00-99.00 | 83.05±31.11 | -1.32 | 2.55 | 0.37 | |
| 23BJ | 53.00-82.00 | 67.88±17.28 | -0.13 | 0.00 | 0.25 | |
| 23MS | 69.00-104.00 | 88.23±12.59 | -0.04 | 0.90 | 0.14 | |
| PH | 22BJ | 131.50-315.67 | 230.39±52.01 | -0.33 | 0.17 | 0.23 |
| 22MS | 113.00-302.00 | 227.27±45.40 | -0.28 | 0.13 | 0.20 | |
| 23BJ | 90.33-257.33 | 183.66±39.61 | -0.44 | 0.68 | 0.22 | |
| 23MS | 134.00-323.67 | 233.58±54.45 | -0.29 | 0.06 | 0.23 | |
| EH | 22BJ | 34.67-142.33 | 87.70±23.85 | -0.07 | -0.46 | 0.27 |
| 22MS | 17.33-168.00 | 74.66±24.73 | 0.28 | 0.36 | 0.33 | |
| 23BJ | 20.00-125.33 | 69.68±19.79 | -0.16 | -0.28 | 0.28 | |
| 23MS | 23.67-145.33 | 86.81±27.89 | -0.07 | -0.41 | 0.32 | |
| EL | 22BJ | 5.00-22.00 | 13.99±3.99 | 0.11 | 0.62 | 0.29 |
| 22MS | 6.70-20.80 | 14.54±4.03 | 0.16 | 0.15 | 0.28 | |
| 23BJ | 5.00-22.33 | 13.23±4.22 | 0.25 | 0.16 | 0.32 | |
| 23MS | 8.50-20.00 | 13.60±4.53 | 0.46 | 0.17 | 0.33 | |
| KNR | 22BJ | 2.00-44.67 | 21.93±8.32 | -0.45 | 0.58 | 0.38 |
| 22MS | 10.00-41.00 | 24.36±7.90 | -0.16 | 0.05 | 0.32 | |
| 23BJ | 3.00-39.00 | 19.47±7.56 | 0.13 | 0.15 | 0.39 | |
| 23MS | 10.00-39.33 | 24.48±8.68 | -0.06 | -0.22 | 0.35 | |
| ERN | 22BJ | 7.50-19.67 | 13.49±3.78 | 0.04 | -0.41 | 0.28 |
| 22MS | 6.00-20.00 | 13.62±3.89 | 0.05 | -0.10 | 0.29 | |
| 23BJ | 8.00-20.67 | 12.88±4.01 | 0.43 | -0.01 | 0.31 | |
| 23MS | 7.33-20.00 | 13.86±4.48 | -0.09 | -0.50 | 0.32 |
Table 2 Descriptive statistical analysis of six agronomic traits across four environments
| Trait | Environment | Range | Means±SD | Skew | Kurt | Coefficient of variation (%) |
|---|---|---|---|---|---|---|
| DTA | 22BJ | 48.00-72.00 | 61.41±15.29 | -0.56 | 0.11 | 0.25 |
| 22MS | 54.00-99.00 | 83.05±31.11 | -1.32 | 2.55 | 0.37 | |
| 23BJ | 53.00-82.00 | 67.88±17.28 | -0.13 | 0.00 | 0.25 | |
| 23MS | 69.00-104.00 | 88.23±12.59 | -0.04 | 0.90 | 0.14 | |
| PH | 22BJ | 131.50-315.67 | 230.39±52.01 | -0.33 | 0.17 | 0.23 |
| 22MS | 113.00-302.00 | 227.27±45.40 | -0.28 | 0.13 | 0.20 | |
| 23BJ | 90.33-257.33 | 183.66±39.61 | -0.44 | 0.68 | 0.22 | |
| 23MS | 134.00-323.67 | 233.58±54.45 | -0.29 | 0.06 | 0.23 | |
| EH | 22BJ | 34.67-142.33 | 87.70±23.85 | -0.07 | -0.46 | 0.27 |
| 22MS | 17.33-168.00 | 74.66±24.73 | 0.28 | 0.36 | 0.33 | |
| 23BJ | 20.00-125.33 | 69.68±19.79 | -0.16 | -0.28 | 0.28 | |
| 23MS | 23.67-145.33 | 86.81±27.89 | -0.07 | -0.41 | 0.32 | |
| EL | 22BJ | 5.00-22.00 | 13.99±3.99 | 0.11 | 0.62 | 0.29 |
| 22MS | 6.70-20.80 | 14.54±4.03 | 0.16 | 0.15 | 0.28 | |
| 23BJ | 5.00-22.33 | 13.23±4.22 | 0.25 | 0.16 | 0.32 | |
| 23MS | 8.50-20.00 | 13.60±4.53 | 0.46 | 0.17 | 0.33 | |
| KNR | 22BJ | 2.00-44.67 | 21.93±8.32 | -0.45 | 0.58 | 0.38 |
| 22MS | 10.00-41.00 | 24.36±7.90 | -0.16 | 0.05 | 0.32 | |
| 23BJ | 3.00-39.00 | 19.47±7.56 | 0.13 | 0.15 | 0.39 | |
| 23MS | 10.00-39.33 | 24.48±8.68 | -0.06 | -0.22 | 0.35 | |
| ERN | 22BJ | 7.50-19.67 | 13.49±3.78 | 0.04 | -0.41 | 0.28 |
| 22MS | 6.00-20.00 | 13.62±3.89 | 0.05 | -0.10 | 0.29 | |
| 23BJ | 8.00-20.67 | 12.88±4.01 | 0.43 | -0.01 | 0.31 | |
| 23MS | 7.33-20.00 | 13.86±4.48 | -0.09 | -0.50 | 0.32 |
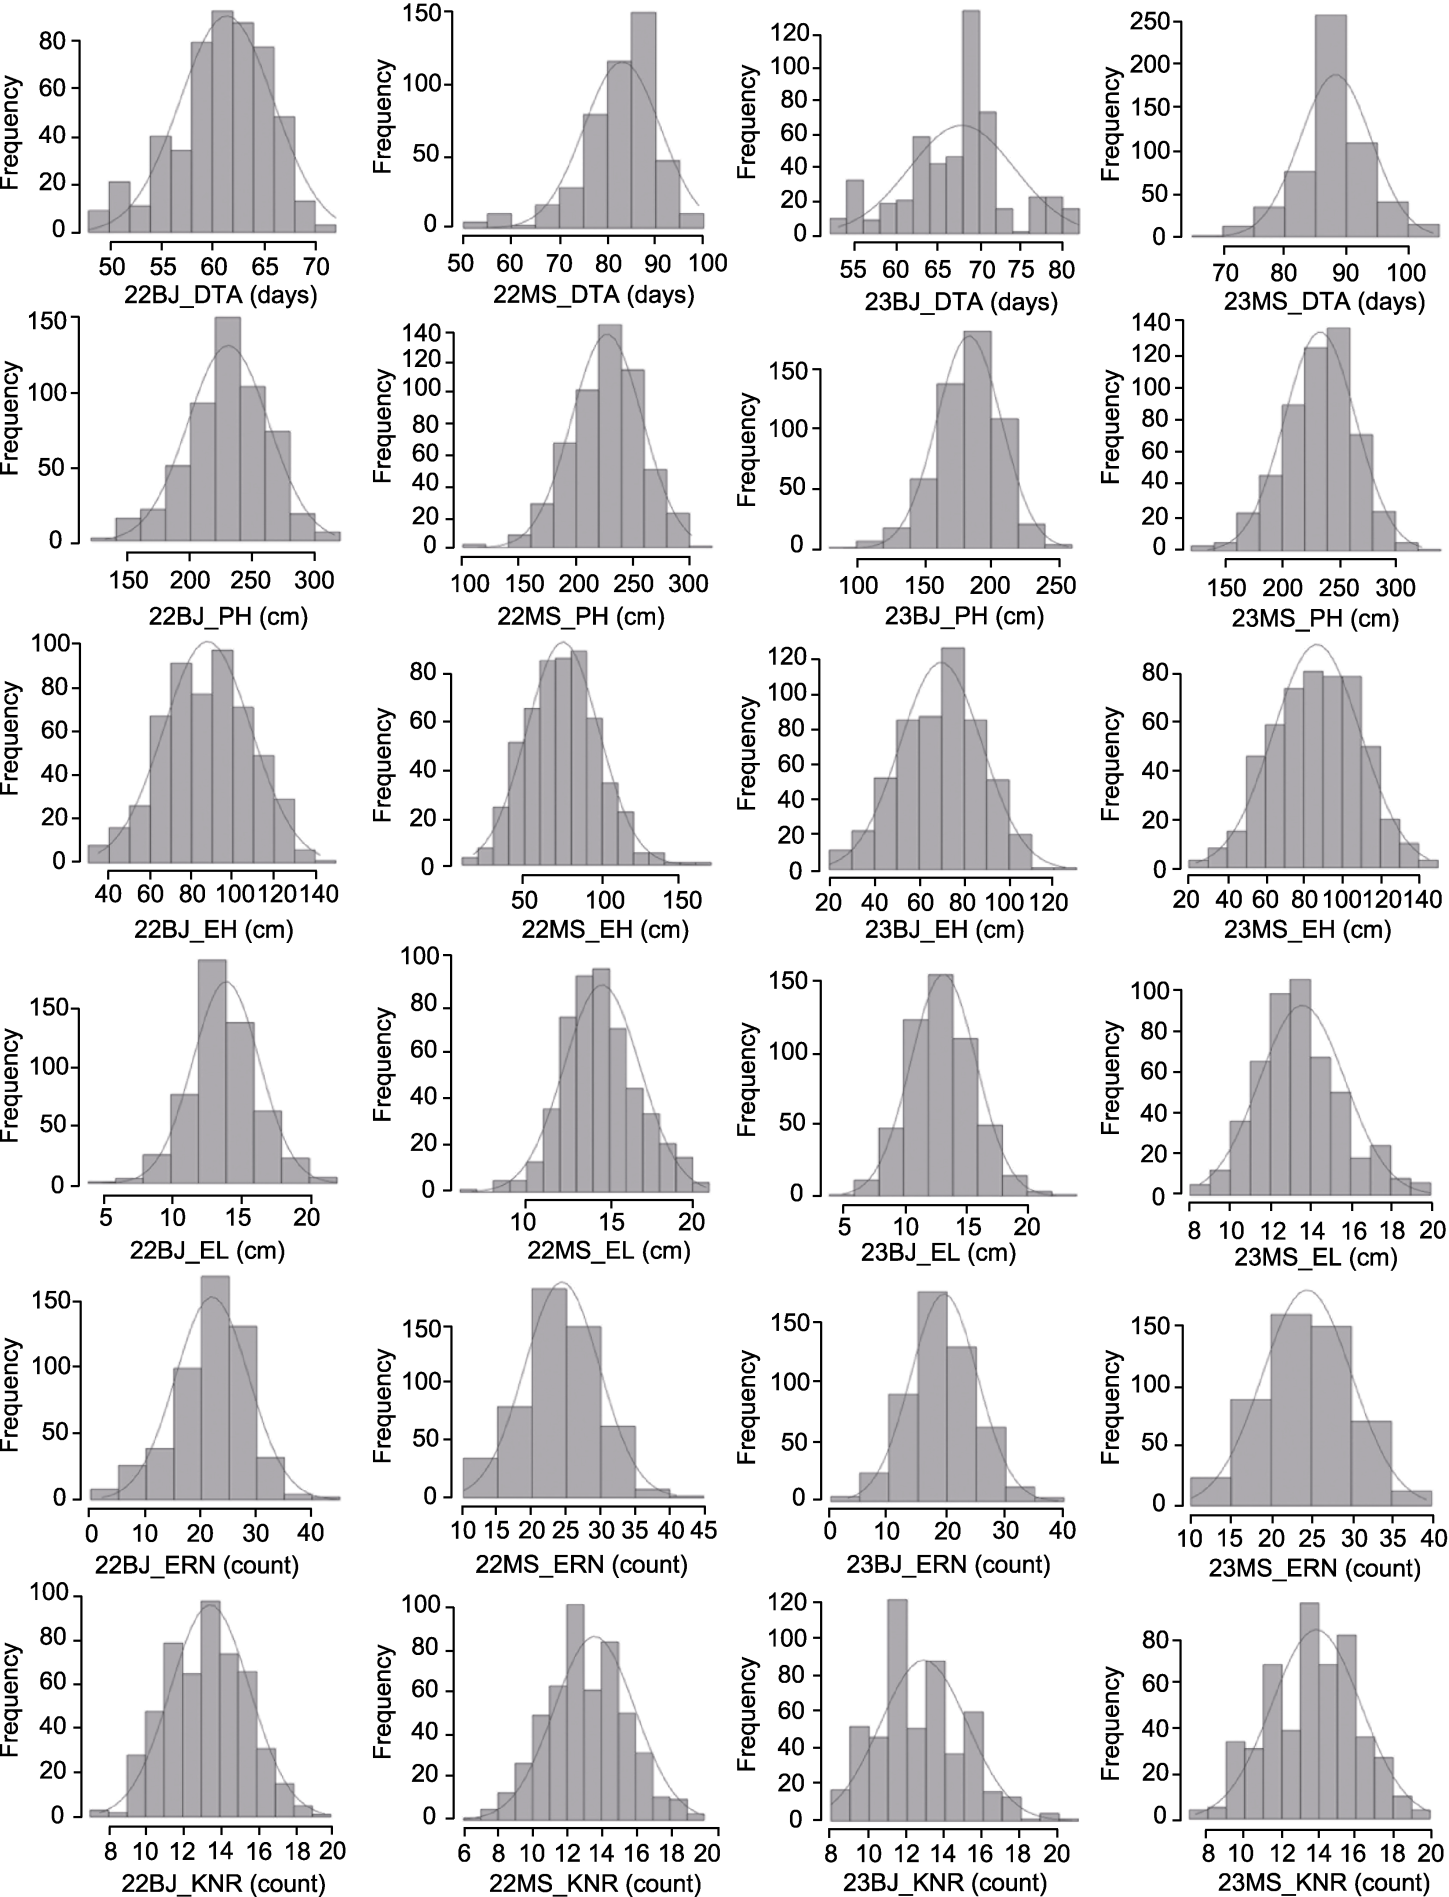
Figure 2 Normal distribution of phenotype performance of six traits in four environments DTA, PH, EH, EL, KNR, and ERN are the same as shown in Table 2.
| Trait | σ2g | σ2ge | H2 | SE (H2) |
|---|---|---|---|---|
| DTA | 27.65*** | 8.79*** | 0.67 | 0.08 |
| PH | 736.31*** | 104.94*** | 0.76 | 0.01 |
| EH | 370.33*** | 67.62*** | 0.74 | 0.02 |
| EL | 2.94*** | 1.09*** | 0.50 | 0.26 |
| KNR | 13.74*** | 7.69*** | 0.38 | 0.04 |
| ERN | 3.25*** | 0.49*** | 0.60 | 0.46 |
Table 3 ANOVA analysis of variance of phenotypes of six agronomic traits in four environments
| Trait | σ2g | σ2ge | H2 | SE (H2) |
|---|---|---|---|---|
| DTA | 27.65*** | 8.79*** | 0.67 | 0.08 |
| PH | 736.31*** | 104.94*** | 0.76 | 0.01 |
| EH | 370.33*** | 67.62*** | 0.74 | 0.02 |
| EL | 2.94*** | 1.09*** | 0.50 | 0.26 |
| KNR | 13.74*** | 7.69*** | 0.38 | 0.04 |
| ERN | 3.25*** | 0.49*** | 0.60 | 0.46 |
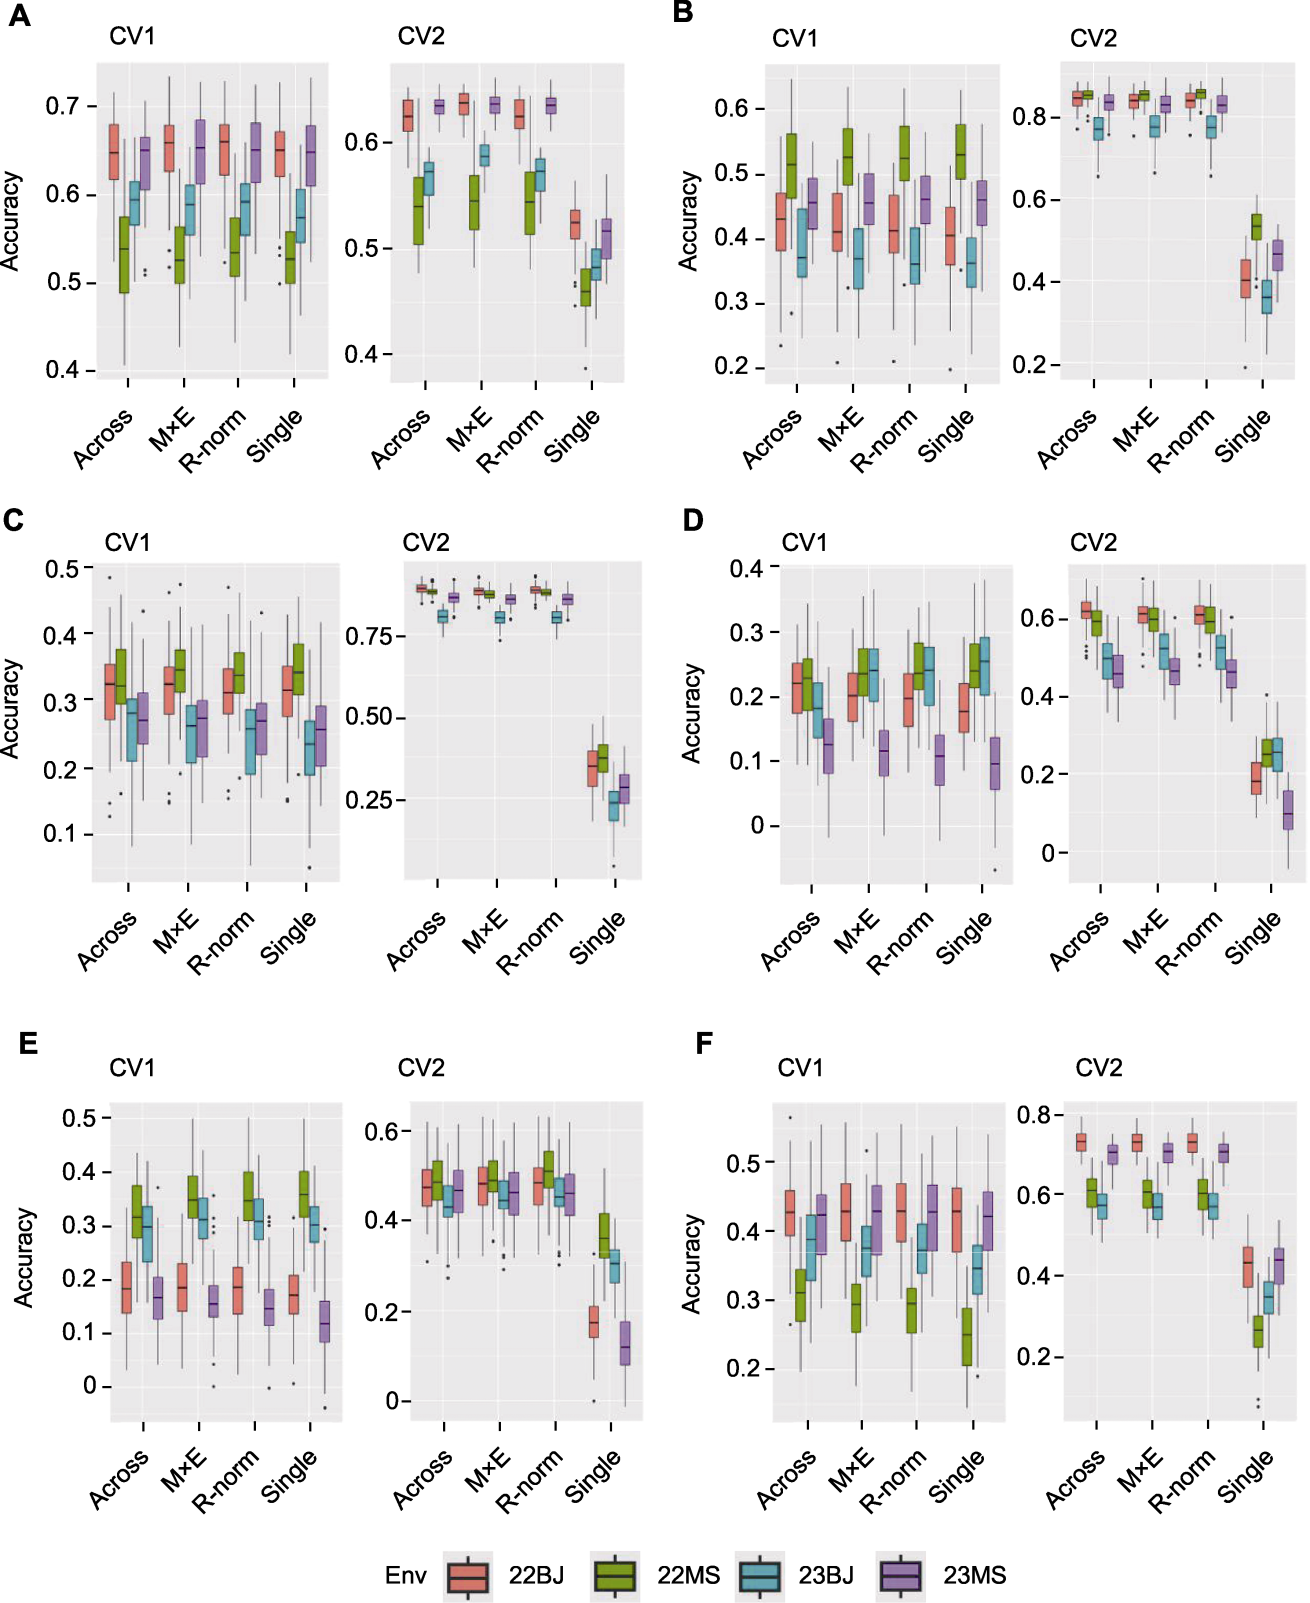
Figure 3 Correlation between observed and predicted values of different models of CV1 and CV2 for different traits The Single model uses single-environment data to predict, and the Across model, M×E model and R-norm model use three environmental data to predict phenotypic data in the remaining environment. (A) Days to anthesis (DTA); (B) Ear height (EH); (C) Plant height (PH); (D) Ear length (EL); (E) Kernel number per row (KNR); (F) Ear row number (ERN)
| CV1 | CV2 | ||||||||
|---|---|---|---|---|---|---|---|---|---|
| Single | Across | M×E | R-norm | Single | Across | M×E | R-norm | ||
| DTA | 22BJ | 17.05 | 15.96 | 16.19 | 16.19 | 17.03 | 8.07 | 6.28 | 7.47 |
| 22MS | 49.26 | 49.31 | 48.03 | 48.22 | 47.63 | 34.46 | 33.25 | 33.94 | |
| 23BJ | 29.44 | 28.85 | 28.53 | 28.56 | 29.49 | 19.29 | 16.63 | 18.75 | |
| 23MS | 23.67 | 23.52 | 22.91 | 22.94 | 24.07 | 9.41 | 9.43 | 9.62 | |
| EH | 22BJ | 351.07 | 339.97 | 343.11 | 343.84 | 351.35 | 125.72 | 129.73 | 128.55 |
| 22MS | 388.25 | 400.24 | 384.77 | 384.73 | 377.25 | 164.68 | 162.07 | 158.30 | |
| 23BJ | 237.92 | 232.14 | 233.07 | 233.30 | 237.86 | 144.16 | 133.37 | 134.57 | |
| 23MS | 405.39 | 401.68 | 397.68 | 398.11 | 406.28 | 174.36 | 176.11 | 175.36 | |
| PH | 22BJ | 819.45 | 816.72 | 816.21 | 816.97 | 833.93 | 218.41 | 232.62 | 225.98 |
| 22MS | 786.00 | 787.15 | 780.27 | 780.59 | 784.60 | 214.57 | 224.97 | 216.90 | |
| 23BJ | 468.62 | 470.77 | 469.01 | 470.20 | 468.00 | 223.87 | 216.31 | 217.63 | |
| 23MS | 895.11 | 885.29 | 893.44 | 893.03 | 919.63 | 292.51 | 302.67 | 299.63 | |
| EL | 22BJ | 4.61 | 4.55 | 4.58 | 4.60 | 4.61 | 3.00 | 3.05 | 3.05 |
| 22MS | 3.89 | 3.95 | 3.92 | 3.91 | 3.77 | 2.68 | 2.63 | 2.64 | |
| 23BJ | 4.60 | 4.74 | 4.63 | 4.63 | 4.59 | 3.71 | 3.60 | 3.59 | |
| 23MS | 3.95 | 3.90 | 3.96 | 3.98 | 3.88 | 3.23 | 3.20 | 3.23 | |
| KNR | 22BJ | 2.60 | 2.58 | 2.57 | 2.57 | 2.60 | 1.51 | 1.51 | 1.52 |
| 22MS | 3.67 | 3.53 | 3.58 | 3.58 | 3.57 | 2.46 | 2.47 | 2.47 | |
| 23BJ | 3.09 | 3.00 | 3.01 | 3.01 | 3.08 | 2.52 | 2.49 | 2.49 | |
| 23MS | 3.62 | 3.62 | 3.58 | 3.58 | 3.47 | 2.18 | 2.16 | 2.16 | |
| ERN | 22BJ | 29.68 | 29.41 | 29.60 | 29.59 | 29.65 | 23.72 | 23.80 | 23.64 |
| 22MS | 22.05 | 22.62 | 22.10 | 22.00 | 21.78 | 19.06 | 18.84 | 18.47 | |
| 23BJ | 21.78 | 21.98 | 21.59 | 21.57 | 21.77 | 19.90 | 19.60 | 19.32 | |
| 23MS | 26.27 | 25.70 | 25.90 | 26.09 | 25.12 | 20.06 | 20.02 | 20.11 | |
Table 4 Mean squared error (MSE) analysis of different models of CV1 and CV2 for different traits
| CV1 | CV2 | ||||||||
|---|---|---|---|---|---|---|---|---|---|
| Single | Across | M×E | R-norm | Single | Across | M×E | R-norm | ||
| DTA | 22BJ | 17.05 | 15.96 | 16.19 | 16.19 | 17.03 | 8.07 | 6.28 | 7.47 |
| 22MS | 49.26 | 49.31 | 48.03 | 48.22 | 47.63 | 34.46 | 33.25 | 33.94 | |
| 23BJ | 29.44 | 28.85 | 28.53 | 28.56 | 29.49 | 19.29 | 16.63 | 18.75 | |
| 23MS | 23.67 | 23.52 | 22.91 | 22.94 | 24.07 | 9.41 | 9.43 | 9.62 | |
| EH | 22BJ | 351.07 | 339.97 | 343.11 | 343.84 | 351.35 | 125.72 | 129.73 | 128.55 |
| 22MS | 388.25 | 400.24 | 384.77 | 384.73 | 377.25 | 164.68 | 162.07 | 158.30 | |
| 23BJ | 237.92 | 232.14 | 233.07 | 233.30 | 237.86 | 144.16 | 133.37 | 134.57 | |
| 23MS | 405.39 | 401.68 | 397.68 | 398.11 | 406.28 | 174.36 | 176.11 | 175.36 | |
| PH | 22BJ | 819.45 | 816.72 | 816.21 | 816.97 | 833.93 | 218.41 | 232.62 | 225.98 |
| 22MS | 786.00 | 787.15 | 780.27 | 780.59 | 784.60 | 214.57 | 224.97 | 216.90 | |
| 23BJ | 468.62 | 470.77 | 469.01 | 470.20 | 468.00 | 223.87 | 216.31 | 217.63 | |
| 23MS | 895.11 | 885.29 | 893.44 | 893.03 | 919.63 | 292.51 | 302.67 | 299.63 | |
| EL | 22BJ | 4.61 | 4.55 | 4.58 | 4.60 | 4.61 | 3.00 | 3.05 | 3.05 |
| 22MS | 3.89 | 3.95 | 3.92 | 3.91 | 3.77 | 2.68 | 2.63 | 2.64 | |
| 23BJ | 4.60 | 4.74 | 4.63 | 4.63 | 4.59 | 3.71 | 3.60 | 3.59 | |
| 23MS | 3.95 | 3.90 | 3.96 | 3.98 | 3.88 | 3.23 | 3.20 | 3.23 | |
| KNR | 22BJ | 2.60 | 2.58 | 2.57 | 2.57 | 2.60 | 1.51 | 1.51 | 1.52 |
| 22MS | 3.67 | 3.53 | 3.58 | 3.58 | 3.57 | 2.46 | 2.47 | 2.47 | |
| 23BJ | 3.09 | 3.00 | 3.01 | 3.01 | 3.08 | 2.52 | 2.49 | 2.49 | |
| 23MS | 3.62 | 3.62 | 3.58 | 3.58 | 3.47 | 2.18 | 2.16 | 2.16 | |
| ERN | 22BJ | 29.68 | 29.41 | 29.60 | 29.59 | 29.65 | 23.72 | 23.80 | 23.64 |
| 22MS | 22.05 | 22.62 | 22.10 | 22.00 | 21.78 | 19.06 | 18.84 | 18.47 | |
| 23BJ | 21.78 | 21.98 | 21.59 | 21.57 | 21.77 | 19.90 | 19.60 | 19.32 | |
| 23MS | 26.27 | 25.70 | 25.90 | 26.09 | 25.12 | 20.06 | 20.02 | 20.11 | |
| Trait | TRN | Model | CV1 | CV2 | Trait | TRN | Model | CV1 | CV2 |
|---|---|---|---|---|---|---|---|---|---|
| DTA | 0.5 | Single | 0.59 | 0.59 | EH | 0.5 | Single | 0.44 | 0.44 |
| 0.5 | Across | 0.60 | 0.78 | 0.5 | Across | 0.45 | 0.82 | ||
| 0.5 | M×E | 0.60 | 0.80 | 0.5 | M×E | 0.44 | 0.82 | ||
| 0.5 | R-norm | 0.61 | 0.79 | 0.5 | R-norm | 0.44 | 0.82 | ||
| 0.7 | Single | 0.62 | 0.63 | 0.7 | Single | 0.47 | 0.46 | ||
| 0.7 | Across | 0.63 | 0.81 | 0.7 | Across | 0.47 | 0.82 | ||
| 0.7 | M×E | 0.63 | 0.83 | 0.7 | M×E | 0.47 | 0.83 | ||
| 0.7 | R-norm | 0.63 | 0.81 | 0.7 | R-norm | 0.47 | 0.83 | ||
| 0.9 | Single | 0.62 | 0.63 | 0.9 | Single | 0.50 | 0.48 | ||
| 0.9 | Across | 0.63 | 0.81 | 0.9 | Across | 0.51 | 0.84 | ||
| 0.9 | M×E | 0.63 | 0.84 | 0.9 | M×E | 0.51 | 0.85 | ||
| 0.9 | R-norm | 0.63 | 0.82 | 0.9 | R-norm | 0.51 | 0.84 | ||
| PH | 0.5 | Single | 0.28 | 0.31 | EL | 0.5 | Single | 0.20 | 0.20 |
| 0.5 | Across | 0.29 | 0.86 | 0.5 | Across | 0.19 | 0.54 | ||
| 0.5 | M×E | 0.29 | 0.85 | 0.5 | M×E | 0.20 | 0.55 | ||
| 0.5 | R-norm | 0.29 | 0.86 | 0.5 | R-norm | 0.20 | 0.55 | ||
| 0.7 | Single | 0.32 | 0.34 | 0.7 | Single | 0.23 | 0.22 | ||
| 0.7 | Across | 0.33 | 0.85 | 0.7 | Across | 0.22 | 0.61 | ||
| 0.7 | M×E | 0.33 | 0.85 | 0.7 | M×E | 0.23 | 0.62 | ||
| 0.7 | R-norm | 0.33 | 0.85 | 0.7 | R-norm | 0.23 | 0.62 | ||
| 0.9 | Single | 0.35 | 0.32 | 0.9 | Single | 0.23 | 0.22 | ||
| 0.9 | Across | 0.37 | 0.85 | 0.9 | Across | 0.23 | 0.61 | ||
| 0.9 | M×E | 0.36 | 0.85 | 0.9 | M×E | 0.24 | 0.62 | ||
| 0.9 | R-norm | 0.36 | 0.85 | 0.9 | R-norm | 0.24 | 0.62 | ||
| KNR | 0.5 | Single | 0.24 | 0.24 | ERN | 0.5 | Single | 0.36 | 0.37 |
| 0.5 | Across | 0.24 | 0.47 | 0.5 | Across | 0.39 | 0.65 | ||
| 0.5 | M×E | 0.26 | 0.47 | 0.5 | M×E | 0.38 | 0.65 | ||
| 0.5 | R-norm | 0.25 | 0.48 | 0.5 | R-norm | 0.38 | 0.65 | ||
| 0.7 | Single | 0.27 | 0.27 | 0.7 | Single | 0.38 | 0.39 | ||
| 0.7 | Across | 0.27 | 0.53 | 0.7 | Across | 0.40 | 0.69 | ||
| 0.7 | M×E | 0.28 | 0.54 | 0.7 | M×E | 0.40 | 0.69 | ||
| 0.7 | R-norm | 0.28 | 0.54 | 0.7 | R-norm | 0.40 | 0.69 | ||
| 0.9 | Single | 0.26 | 0.28 | 0.9 | Single | 0.40 | 0.40 | ||
| 0.9 | Across | 0.26 | 0.55 | 0.9 | Across | 0.42 | 0.70 | ||
| 0.9 | M×E | 0.27 | 0.56 | 0.9 | M×E | 0.42 | 0.70 | ||
| 0.9 | R-norm | 0.27 | 0.57 | 0.9 | R-norm | 0.42 | 0.70 |
Table 5 Prediction results of four models with different percentage of training populations (TRN) in CV1 and CV2
| Trait | TRN | Model | CV1 | CV2 | Trait | TRN | Model | CV1 | CV2 |
|---|---|---|---|---|---|---|---|---|---|
| DTA | 0.5 | Single | 0.59 | 0.59 | EH | 0.5 | Single | 0.44 | 0.44 |
| 0.5 | Across | 0.60 | 0.78 | 0.5 | Across | 0.45 | 0.82 | ||
| 0.5 | M×E | 0.60 | 0.80 | 0.5 | M×E | 0.44 | 0.82 | ||
| 0.5 | R-norm | 0.61 | 0.79 | 0.5 | R-norm | 0.44 | 0.82 | ||
| 0.7 | Single | 0.62 | 0.63 | 0.7 | Single | 0.47 | 0.46 | ||
| 0.7 | Across | 0.63 | 0.81 | 0.7 | Across | 0.47 | 0.82 | ||
| 0.7 | M×E | 0.63 | 0.83 | 0.7 | M×E | 0.47 | 0.83 | ||
| 0.7 | R-norm | 0.63 | 0.81 | 0.7 | R-norm | 0.47 | 0.83 | ||
| 0.9 | Single | 0.62 | 0.63 | 0.9 | Single | 0.50 | 0.48 | ||
| 0.9 | Across | 0.63 | 0.81 | 0.9 | Across | 0.51 | 0.84 | ||
| 0.9 | M×E | 0.63 | 0.84 | 0.9 | M×E | 0.51 | 0.85 | ||
| 0.9 | R-norm | 0.63 | 0.82 | 0.9 | R-norm | 0.51 | 0.84 | ||
| PH | 0.5 | Single | 0.28 | 0.31 | EL | 0.5 | Single | 0.20 | 0.20 |
| 0.5 | Across | 0.29 | 0.86 | 0.5 | Across | 0.19 | 0.54 | ||
| 0.5 | M×E | 0.29 | 0.85 | 0.5 | M×E | 0.20 | 0.55 | ||
| 0.5 | R-norm | 0.29 | 0.86 | 0.5 | R-norm | 0.20 | 0.55 | ||
| 0.7 | Single | 0.32 | 0.34 | 0.7 | Single | 0.23 | 0.22 | ||
| 0.7 | Across | 0.33 | 0.85 | 0.7 | Across | 0.22 | 0.61 | ||
| 0.7 | M×E | 0.33 | 0.85 | 0.7 | M×E | 0.23 | 0.62 | ||
| 0.7 | R-norm | 0.33 | 0.85 | 0.7 | R-norm | 0.23 | 0.62 | ||
| 0.9 | Single | 0.35 | 0.32 | 0.9 | Single | 0.23 | 0.22 | ||
| 0.9 | Across | 0.37 | 0.85 | 0.9 | Across | 0.23 | 0.61 | ||
| 0.9 | M×E | 0.36 | 0.85 | 0.9 | M×E | 0.24 | 0.62 | ||
| 0.9 | R-norm | 0.36 | 0.85 | 0.9 | R-norm | 0.24 | 0.62 | ||
| KNR | 0.5 | Single | 0.24 | 0.24 | ERN | 0.5 | Single | 0.36 | 0.37 |
| 0.5 | Across | 0.24 | 0.47 | 0.5 | Across | 0.39 | 0.65 | ||
| 0.5 | M×E | 0.26 | 0.47 | 0.5 | M×E | 0.38 | 0.65 | ||
| 0.5 | R-norm | 0.25 | 0.48 | 0.5 | R-norm | 0.38 | 0.65 | ||
| 0.7 | Single | 0.27 | 0.27 | 0.7 | Single | 0.38 | 0.39 | ||
| 0.7 | Across | 0.27 | 0.53 | 0.7 | Across | 0.40 | 0.69 | ||
| 0.7 | M×E | 0.28 | 0.54 | 0.7 | M×E | 0.40 | 0.69 | ||
| 0.7 | R-norm | 0.28 | 0.54 | 0.7 | R-norm | 0.40 | 0.69 | ||
| 0.9 | Single | 0.26 | 0.28 | 0.9 | Single | 0.40 | 0.40 | ||
| 0.9 | Across | 0.26 | 0.55 | 0.9 | Across | 0.42 | 0.70 | ||
| 0.9 | M×E | 0.27 | 0.56 | 0.9 | M×E | 0.42 | 0.70 | ||
| 0.9 | R-norm | 0.27 | 0.57 | 0.9 | R-norm | 0.42 | 0.70 |
| [1] |
Alemu A, Åstrand J, Montesinos-López OA, Isidro Y, Sánchez J, Fernández-Gónzalez J, Tadesse W, Vetukuri RR, Carlsson AS, Ceplitis A, Crossa J, Ortiz R, Chawade A (2024). Genomic selection in plant breeding: key factors shaping two decades of progress. Mol Plant 17, 552-578.
DOI PMID |
| [2] | Burgueño J, De Los Campos G, Weigel K, Crossa J (2012). Genomic prediction of breeding values when modeling genotype × environment interaction using pedigree and dense molecular markers. Crop Sci 52, 707-719. |
| [3] | Carena MJ, Hallauer AR, Filho JBM (2010). Quantitative Genetics in Maize Breeding. New York: Springer Science & Business Media. pp. 1-6. |
| [4] |
Crossa J, De Los Campos G, Pérez P, Gianola D, Burgueño J, Araus JL, Makumbi D, Singh RP, Dreisigacker S, Yan JB, Arief V, Banziger M, Braun HJ (2010). Prediction of genetic values of quantitative traits in plant breeding using pedigree and molecular markers. Genetics 186, 713-724.
DOI PMID |
| [5] | Cuevas J, Crossa J, Soberanis V, Pérez-Elizalde S, Pérez- Rodríguez P, De Los Campos G, Montesinos-López OA, Burgueño J (2016). Genomic prediction of genotype × environment interaction kernel regression models. Plant Genome 9, plantgenome2016. 03.0024. |
| [6] | Ferrão LFV, Ferrão RG, Ferrão MAG, Francisco A, Garcia AAF (2017). A mixed model to multiple harvest-location trials applied to genomic prediction in Coffea canephora. Tree Genet Genomes 13, 95. |
| [7] | Fu JJ, Hao YF, Li HH, Reif JC, Chen SJ, Huang CL, Wang GY, Li XH, Xu YB, Li L (2022). Integration of genomic selection with doubled-haploid evaluation in hybrid breeding: from GS 1.0 to GS 4.0 and beyond. Mol Plant 15, 577-580. |
| [8] |
Hayes BJ, Bowman PJ, Chamberlain AJ, Goddard ME (2009). Invited review: genomic selection in dairy cattle: progress and challenges. J Dairy Sci 92, 433-443.
DOI PMID |
| [9] | Jannink JL, Lorenz AJ, Iwata H (2010). Genomic selection in plant breeding: from theory to practice. Brief Funct Genomics 9, 166-177. |
| [10] |
Jarquín D, Crossa J, Lacaze X, Du Cheyron P, Daucourt J, Lorgeou J, Piraux F, Guerreiro L, Pérez P, Calus M, Burgueño J, De Los Campos G (2014). A reaction norm model for genomic selection using high-dimensional genomic and environmental data. Theor Appl Genet 127, 595-607.
DOI PMID |
| [11] | Jarquin D, Howard R, Crossa J, Beyene Y, Gowda M, Martini JWR, Pazaran GC, Burgueño J, Pacheco A, Grondona M, Wimmer V, Prasanna BM (2020). Genomic prediction enhanced sparse testing for multi-environment trials. G3 (Bethesda) 10, 2725-2739. |
| [12] | Lopez-Cruz M, Crossa J, Bonnett D, Dreisigacker S, Poland J, Jannink JL, Singh RP, Autrique E, De Los Campos G (2015). Increased prediction accuracy in wheat breeding trials using a marker × environment interaction genomic selection model. G3 (Bethesda) 5, 569-582. |
| [13] | Lorenz AJ (2013). Resource allocation for maximizing prediction accuracy and genetic gain of genomic selection in plant breeding: a simulation experiment. G3(Bethesda) 3, 481-491. |
| [14] |
Luo P, Wang HW, Ni ZY, Yang RS, Wang F, Yong HY, Zhang L, Zhou ZQ, Song W, Li MS, Yang J, Weng JF, Meng ZD, Zhang DG, Han JN, Chen Y, Zhang RZ, Wang LW, Zhao M, Gao WW, Chen XY, Li WJ, Hao ZF, Fu JJ, Zhang XC, Li XH (2023). Genomic prediction of yield performance among single-cross maize hybrids using a partial diallel cross design. Crop J 11, 1884-1892.
DOI |
| [15] |
Meuwissen THE, Hayes BJ, Goddard ME (2001). Prediction of total genetic value using genome-wide dense marker maps. Genetics 157, 1819-1829.
DOI PMID |
| [16] |
Pérez P, De Los Campos G (2014). Genome-wide regression and prediction with the BGLR statistical package. Genetics 198, 483-495.
DOI PMID |
| [17] |
Roorkiwal M, Jarquin D, Singh MK, Gaur PM, Bharadwaj C, Rathore A, Howard R, Srinivasan S, Jain A, Garg V, Kale S, Chitikineni A, Tripathi S, Jones E, Robbins KR, Crossa J, Varshney RK (2018). Genomic-enabled prediction models using multi-environment trials to estimate the effect of genotype × environment interaction on predic-tion accuracy in chickpea. Sci Rep 8, 11701.
DOI PMID |
| [18] | Sousa MBE, Cuevas J, de Oliveira Couto EG, Pérez- Rodríguez P, Jarquín D, Fritsche-Neto R, Burgueño J, Crossa J (2017). Genomic-enabled prediction in maize using kernel models with genotype × environment interaction. G3 (Bethesda) 7, 1995-2014. |
| [19] | Terraillon J, Roeber FK, Flachenecker C, Frisch M (2023). Training set designs for prediction of yield and moisture of maize test cross hybrids with unreplicated trials. Front Plant Sci 14, 1080087. |
| [20] |
VanRaden PM (2008). Efficient methods to compute genomic predictions. J Dairy Sci 91, 4414-4423.
DOI PMID |
| [21] |
Wang BB, Lin ZC, Li X, Zhao YP, Zhao BB, Wu GX, Ma XJ, Wang H, Xie YR, Li QQ, Song GS, Kong DX, Zheng ZG, Wei HB, Shen RX, Wu H, Chen CX, Meng ZD, Wang TY, Li Y, Li XH, Chen YH, Lai JS, Hufford MB, Ross-Ibarra J, He H, Wang HY (2020). Genome-wide selection and genetic improvement during modern maize breeding. Nat Genet 52, 565-571.
DOI PMID |
| [22] | Xu YB, Liu XG, Fu JJ, Wang HW, Wang JK, Huang CL, Prasanna BM, Olsen MS, Wang GY, Zhang AM (2019). Enhancing genetic gain through genomic selection: from livestock to plants. Plant Commun 16, 100005. |
| [23] | Yang N, Lu YL, Yang XH, Huang J, Zhou Y, Ali F, Wen WW, Liu J, Li JS, Yan JB (2014). Genome wide association studies using a new nonparametric model reveal the genetic architecture of 17 agronomic traits in an enlarged maize association panel. PLoS Genet 10, e1004573. |
| [24] | Zhu XT, Leiser WL, Hahn V, Würschum T (2021). Training set design in genomic prediction with multiple biparental families. Plant Genome 14, e20124. |
| [1] | LI Yue-Qi, MA Zhong-Hua, LIU Wei-Fan, SU Ming, WAN Meng-Hu, LI Qing-Yun, ZHANG Dan, LIU Ji-Li, WU Na. Effects of vertical deep rotary tillage with organic fertilizer on leaf senescence characteristics and yield of maize in saline soil [J]. Chin J Plant Ecol, 2026, 50(1): 222-236. |
| [2] | Miao Lin. Hormonal 'Code' for the Number of Maize Tassel Branches [J]. Chinese Bulletin of Botany, 2026, 61(1): 157-169. |
| [3] | FAN Yue-Ling, JIANG Zheng-De, YE Jia-Shu, ZHENG Li-Chen, CHEN Xin. Dataset on harvest traits and yield of major crops in long-term farmland observation plots in the Lower Liaohe Plain from 2005 to 2015 [J]. Chin J Plant Ecol, 2025, 49(8): 1271-1282. |
| [4] | ZHU Xi, HE Zhi-Bin, DU Ming-Wu, ZHAO Li-Wen, WU Dan-Dan. Dataset of crop harvest traits and yields from long-term observation plots of oasis farmland ecosystems in the middle part of Hexi Corridor from 2004 to 2010 [J]. Chin J Plant Ecol, 2025, 49(8): 1312-1320. |
| [5] | WANG Li-Long, FENG Jing, SU Na, LIU Xin-Ping, PAN Cheng-Chen, LI Yu-Qiang. Dataset of maize harvest traits and yields from long-term observation plots in typical farmland ecosystems of the Horqin Sandy Land from 2005 to 2015 [J]. Chin J Plant Ecol, 2025, 49(8): 1293-1300. |
| [6] | WANG Zhi-Bo, LIU Wen-Sheng, WU Rui-Jun, WANG Guo-Liang. Dataset of crop harvest traits and yields from long-term observation farmland plots on fluvial terraces in the hilly and gully region of the Loess Plateau from 2018 to 2023 [J]. Chin J Plant Ecol, 2025, 49(8): 1301-1311. |
| [7] | Juan Yang, Yuelei Zhao, Xiaoyuan Chen, Baobao Wang, Haiyang Wang. Regulation Mechanism and Breeding Application of Flowering Time in Maize [J]. Chinese Bulletin of Botany, 2024, 59(6): 912-931. |
| [8] | Hengyu Yan, Zhaoxia Li, Yubin Li. Research Progress on Heat Stress Impact on Maize Growth and Heat-Tolerant Maize Screening in China [J]. Chinese Bulletin of Botany, 2024, 59(6): 1007-1023. |
| [9] | Qiang Zhang, Zhenyu Zhao, Pinghua Li. Research Progress of Gene Editing Technology in Maize [J]. Chinese Bulletin of Botany, 2024, 59(6): 978-998. |
| [10] | Wenli Yang, Zhao Li, Zhiming Liu, Zhihua Zhang, Jinsheng Yang, Yanjie Lü, Yongjun Wang. Senescence Characteristics of Maize Leaves at Different Maturity Stages and Their Effect on Phyllosphere Bacteria [J]. Chinese Bulletin of Botany, 2024, 59(6): 1024-1040. |
| [11] | Tao Wang, Jinglei Feng, Cui Zhang. Research Progress on Molecular Mechanisms of Heat Stress Affecting the Growth and Development of Maize [J]. Chinese Bulletin of Botany, 2024, 59(6): 963-977. |
| [12] | Qingguo Du, Wenxue Li. Research Progress in the Regulation of Development and Stress Responses by Long Non-coding RNAs in Maize [J]. Chinese Bulletin of Botany, 2024, 59(6): 950-962. |
| [13] | Ziyang Wang, Shengxue Liu, Zhirui Yang, Feng Qin. Genetic Dissection of Drought Resistance in Maize [J]. Chinese Bulletin of Botany, 2024, 59(6): 883-902. |
| [14] | Suowei Wu, Xueli An, Xiangyuan Wan. Molecular Mechanisms of Male Sterility and their Applications in Biotechnology-based Male-sterility Hybrid Seed Production in Maize [J]. Chinese Bulletin of Botany, 2024, 59(6): 932-949. |
| [15] | Mingmin Zheng, Qiang Huang, Peng Zhang, Xiaowei Liu, Zhuofan Zhao, Hongyang Yi, Tingzhao Rong, Moju Cao. Research Progress on Cytoplasmic Male Sterility and Fertility Restoration in Maize [J]. Chinese Bulletin of Botany, 2024, 59(6): 999-1006. |
| Viewed | ||||||
|
Full text |
|
|||||
|
Abstract |
|
|||||
 Home
Home