
植物学报 ›› 2024, Vol. 59 ›› Issue (6): 1041-1053.DOI: 10.11983/CBB24087 cstr: 32102.14.CBB24087
所属专题: 玉米生物学与分子设计(2024年59卷6期)
李园1, 范开建1, 安泰2, 李聪3, 蒋俊霞1, 牛皓1, 曾伟伟2, 衡燕芳1, 李虎1, 付俊杰1, 李慧慧1, 黎亮1,*( )
)
收稿日期:2024-06-06
接受日期:2024-10-14
出版日期:2024-11-10
发布日期:2024-10-16
通讯作者:
*黎亮, 研究员, 博士生导师, 中国农业科学院杰出青年英才, 农业农村部神农英才“青年英才”。在玉米单倍体育种技术方面的工作(参与)获得2017年度教育部技术发明一等奖、2017年度大北农科技奖植物育种奖和2023年度国家技术发明二等奖。目前, 研究团队主要聚焦单倍体技术和全基因组选择技术的有机整合, 以构建工程化的育种流程, 实现不同环境下的田间表型预测, 为创制高产耐密宜机收种质提供技术支撑。E-mail: liliang05@caas.cn
基金资助:
Yuan Li1, Kaijian Fan1, Tai An2, Cong Li3, Junxia Jiang1, Hao Niu1, Weiwei Zeng2, Yanfang Heng1, Hu Li1, Junjie Fu1, Huihui Li1, Liang Li1,*()
Received:2024-06-06
Accepted:2024-10-14
Online:2024-11-10
Published:2024-10-16
Contact:
*E-mail: liliang05@caas.cn
摘要: 多环境田间测试是选育高产稳产品种的重要途径, 但因其成本高逐渐成为植物育种的瓶颈问题。将稀疏测试与全基因组预测方法相结合可实现对未测表型的预测, 进而减少田间测试的工作量和成本。利用244份玉米(Zea mays)自然群体自交系在两年(2022年和2023年)两点(北京顺义和黑龙江密山) 4个环境下, 针对散粉期、株高、穗位高、穗长、穗行数和行粒数6个代表性农艺性状开展研究, 比较了4种模型(Single、Across、M×E和R-norm)、2种训练群体组成方案(CV1和CV2)以及3种训练集抽样比例(0.5、0.7和0.9)对预测精度的影响。结果表明,上述6个农艺性状的平均预测精度分别为0.67、0.58、0.50、0.33、0.33和0.48; Single模型、Across模型、M×E模型和R-norm模型的平均预测精度分别为0.36、0.52、0.53和0.53; 其中CV1各模型在不同性状中的预测精度范围在0.19-0.65之间, CV2预测精度范围在0.47-0.89之间; 不同抽样比例比较显示, 不同模型中训练集比例的提升对6个性状的预测精度提升有限, 最大提升幅度仅为0.05。综上表明, 在进行多环境预测时, 利用CV2训练群体组成方案并在预测模型中纳入多个环境下的表型数据可提升预测精度。
李园, 范开建, 安泰, 李聪, 蒋俊霞, 牛皓, 曾伟伟, 衡燕芳, 李虎, 付俊杰, 李慧慧, 黎亮. 玉米自然群体自交系农艺性状的多环境全基因组预测初探. 植物学报, 2024, 59(6): 1041-1053.
Yuan Li, Kaijian Fan, Tai An, Cong Li, Junxia Jiang, Hao Niu, Weiwei Zeng, Yanfang Heng, Hu Li, Junjie Fu, Huihui Li, Liang Li. Study on Multi-environment Genome-wide Prediction of Inbred Agronomic Traits in Maize Natural Populations. Chinese Bulletin of Botany, 2024, 59(6): 1041-1053.
| Trait | Abbreviate | Unit | Description |
|---|---|---|---|
| Days to anthesis | DTA | Days | Recorded the number of days from the planting day to anthesis data when 50% of the plant anthers in the plot were extruded to 1/2 length of the main tassel spindle |
| Plant height | PH | cm | Measured the height of the stem from the ground to the top of the tassel of 3-5 plants |
| Ear height | EH | cm | Measured the height of the stem from the ground to the base of the ear of 3-5 plants |
| Ear length | EL | cm | Measured the length of 3-5 ears |
| Ear row number | ERN | Count | Counted the number of ear row of 3-5 ears |
| Kernel number per row | KNR | Count | Counted the number of kernels per row of 3-5 ears |
表1 244份玉米自交系6个性状的一般信息
Table 1 General information of six maize agronomic traits for 244 inbred lines
| Trait | Abbreviate | Unit | Description |
|---|---|---|---|
| Days to anthesis | DTA | Days | Recorded the number of days from the planting day to anthesis data when 50% of the plant anthers in the plot were extruded to 1/2 length of the main tassel spindle |
| Plant height | PH | cm | Measured the height of the stem from the ground to the top of the tassel of 3-5 plants |
| Ear height | EH | cm | Measured the height of the stem from the ground to the base of the ear of 3-5 plants |
| Ear length | EL | cm | Measured the length of 3-5 ears |
| Ear row number | ERN | Count | Counted the number of ear row of 3-5 ears |
| Kernel number per row | KNR | Count | Counted the number of kernels per row of 3-5 ears |
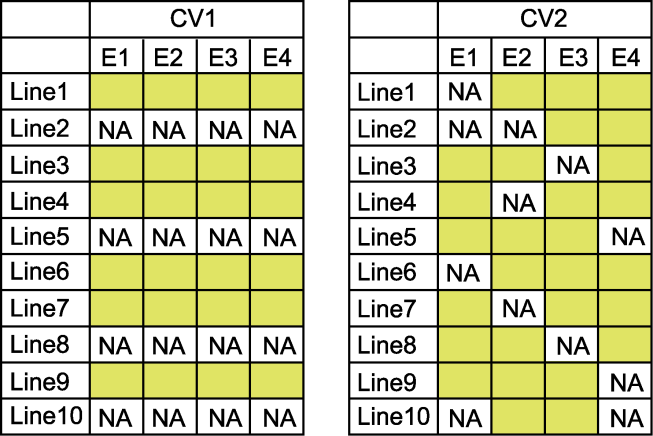
图1 两种交叉验证方案(CV1和CV2) 表格中E1-E4代表不同的环境, NA表示品种表型在该环境下未测试, 黄色空格表示品种表型在该环境测试。
Figure 1 Two distinct cross-validation schemes (CV1 and CV2) In the table, E1-E4 indicate different environments, NA indicate that the variety phenotype was untested in this environment, and the yellow space indicate that the variety phenotype tested in this environment.
| Trait | Environment | Range | Means±SD | Skew | Kurt | Coefficient of variation (%) |
|---|---|---|---|---|---|---|
| DTA | 22BJ | 48.00-72.00 | 61.41±15.29 | -0.56 | 0.11 | 0.25 |
| 22MS | 54.00-99.00 | 83.05±31.11 | -1.32 | 2.55 | 0.37 | |
| 23BJ | 53.00-82.00 | 67.88±17.28 | -0.13 | 0.00 | 0.25 | |
| 23MS | 69.00-104.00 | 88.23±12.59 | -0.04 | 0.90 | 0.14 | |
| PH | 22BJ | 131.50-315.67 | 230.39±52.01 | -0.33 | 0.17 | 0.23 |
| 22MS | 113.00-302.00 | 227.27±45.40 | -0.28 | 0.13 | 0.20 | |
| 23BJ | 90.33-257.33 | 183.66±39.61 | -0.44 | 0.68 | 0.22 | |
| 23MS | 134.00-323.67 | 233.58±54.45 | -0.29 | 0.06 | 0.23 | |
| EH | 22BJ | 34.67-142.33 | 87.70±23.85 | -0.07 | -0.46 | 0.27 |
| 22MS | 17.33-168.00 | 74.66±24.73 | 0.28 | 0.36 | 0.33 | |
| 23BJ | 20.00-125.33 | 69.68±19.79 | -0.16 | -0.28 | 0.28 | |
| 23MS | 23.67-145.33 | 86.81±27.89 | -0.07 | -0.41 | 0.32 | |
| EL | 22BJ | 5.00-22.00 | 13.99±3.99 | 0.11 | 0.62 | 0.29 |
| 22MS | 6.70-20.80 | 14.54±4.03 | 0.16 | 0.15 | 0.28 | |
| 23BJ | 5.00-22.33 | 13.23±4.22 | 0.25 | 0.16 | 0.32 | |
| 23MS | 8.50-20.00 | 13.60±4.53 | 0.46 | 0.17 | 0.33 | |
| KNR | 22BJ | 2.00-44.67 | 21.93±8.32 | -0.45 | 0.58 | 0.38 |
| 22MS | 10.00-41.00 | 24.36±7.90 | -0.16 | 0.05 | 0.32 | |
| 23BJ | 3.00-39.00 | 19.47±7.56 | 0.13 | 0.15 | 0.39 | |
| 23MS | 10.00-39.33 | 24.48±8.68 | -0.06 | -0.22 | 0.35 | |
| ERN | 22BJ | 7.50-19.67 | 13.49±3.78 | 0.04 | -0.41 | 0.28 |
| 22MS | 6.00-20.00 | 13.62±3.89 | 0.05 | -0.10 | 0.29 | |
| 23BJ | 8.00-20.67 | 12.88±4.01 | 0.43 | -0.01 | 0.31 | |
| 23MS | 7.33-20.00 | 13.86±4.48 | -0.09 | -0.50 | 0.32 |
表2 六个农艺性状在4个环境下表型数据描述性统计分析
Table 2 Descriptive statistical analysis of six agronomic traits across four environments
| Trait | Environment | Range | Means±SD | Skew | Kurt | Coefficient of variation (%) |
|---|---|---|---|---|---|---|
| DTA | 22BJ | 48.00-72.00 | 61.41±15.29 | -0.56 | 0.11 | 0.25 |
| 22MS | 54.00-99.00 | 83.05±31.11 | -1.32 | 2.55 | 0.37 | |
| 23BJ | 53.00-82.00 | 67.88±17.28 | -0.13 | 0.00 | 0.25 | |
| 23MS | 69.00-104.00 | 88.23±12.59 | -0.04 | 0.90 | 0.14 | |
| PH | 22BJ | 131.50-315.67 | 230.39±52.01 | -0.33 | 0.17 | 0.23 |
| 22MS | 113.00-302.00 | 227.27±45.40 | -0.28 | 0.13 | 0.20 | |
| 23BJ | 90.33-257.33 | 183.66±39.61 | -0.44 | 0.68 | 0.22 | |
| 23MS | 134.00-323.67 | 233.58±54.45 | -0.29 | 0.06 | 0.23 | |
| EH | 22BJ | 34.67-142.33 | 87.70±23.85 | -0.07 | -0.46 | 0.27 |
| 22MS | 17.33-168.00 | 74.66±24.73 | 0.28 | 0.36 | 0.33 | |
| 23BJ | 20.00-125.33 | 69.68±19.79 | -0.16 | -0.28 | 0.28 | |
| 23MS | 23.67-145.33 | 86.81±27.89 | -0.07 | -0.41 | 0.32 | |
| EL | 22BJ | 5.00-22.00 | 13.99±3.99 | 0.11 | 0.62 | 0.29 |
| 22MS | 6.70-20.80 | 14.54±4.03 | 0.16 | 0.15 | 0.28 | |
| 23BJ | 5.00-22.33 | 13.23±4.22 | 0.25 | 0.16 | 0.32 | |
| 23MS | 8.50-20.00 | 13.60±4.53 | 0.46 | 0.17 | 0.33 | |
| KNR | 22BJ | 2.00-44.67 | 21.93±8.32 | -0.45 | 0.58 | 0.38 |
| 22MS | 10.00-41.00 | 24.36±7.90 | -0.16 | 0.05 | 0.32 | |
| 23BJ | 3.00-39.00 | 19.47±7.56 | 0.13 | 0.15 | 0.39 | |
| 23MS | 10.00-39.33 | 24.48±8.68 | -0.06 | -0.22 | 0.35 | |
| ERN | 22BJ | 7.50-19.67 | 13.49±3.78 | 0.04 | -0.41 | 0.28 |
| 22MS | 6.00-20.00 | 13.62±3.89 | 0.05 | -0.10 | 0.29 | |
| 23BJ | 8.00-20.67 | 12.88±4.01 | 0.43 | -0.01 | 0.31 | |
| 23MS | 7.33-20.00 | 13.86±4.48 | -0.09 | -0.50 | 0.32 |
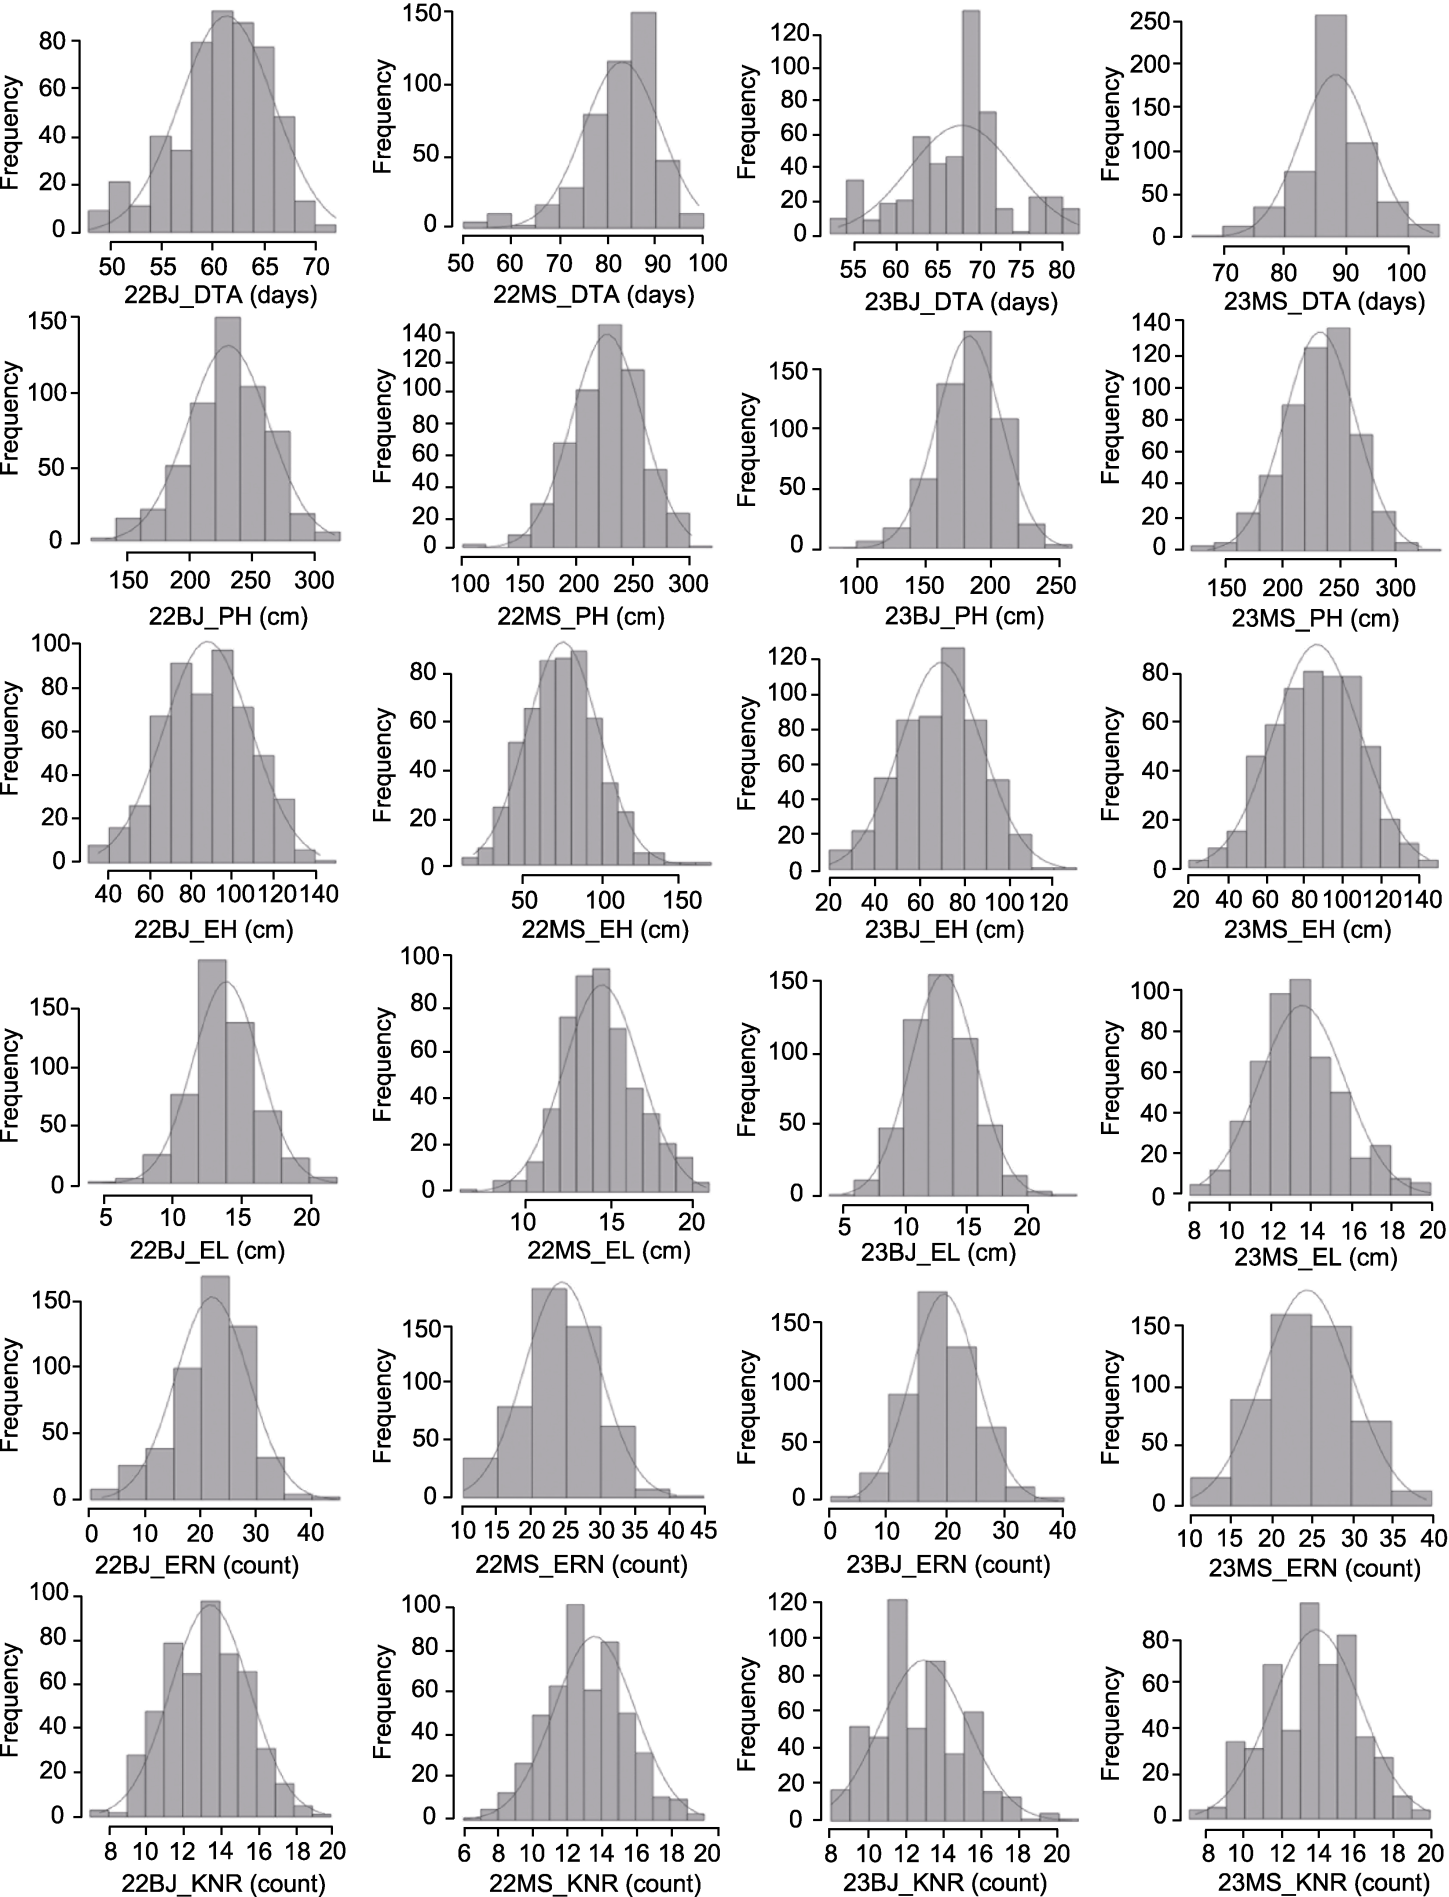
图2 6个农艺性状4个环境下表型的正态分布 DTA、PH、EH、EL、KNR和ERN同表2。
Figure 2 Normal distribution of phenotype performance of six traits in four environments DTA, PH, EH, EL, KNR, and ERN are the same as shown in Table 2.
| Trait | σ2g | σ2ge | H2 | SE (H2) |
|---|---|---|---|---|
| DTA | 27.65*** | 8.79*** | 0.67 | 0.08 |
| PH | 736.31*** | 104.94*** | 0.76 | 0.01 |
| EH | 370.33*** | 67.62*** | 0.74 | 0.02 |
| EL | 2.94*** | 1.09*** | 0.50 | 0.26 |
| KNR | 13.74*** | 7.69*** | 0.38 | 0.04 |
| ERN | 3.25*** | 0.49*** | 0.60 | 0.46 |
表3 6个农艺性状4个环境联合方差分析
Table 3 ANOVA analysis of variance of phenotypes of six agronomic traits in four environments
| Trait | σ2g | σ2ge | H2 | SE (H2) |
|---|---|---|---|---|
| DTA | 27.65*** | 8.79*** | 0.67 | 0.08 |
| PH | 736.31*** | 104.94*** | 0.76 | 0.01 |
| EH | 370.33*** | 67.62*** | 0.74 | 0.02 |
| EL | 2.94*** | 1.09*** | 0.50 | 0.26 |
| KNR | 13.74*** | 7.69*** | 0.38 | 0.04 |
| ERN | 3.25*** | 0.49*** | 0.60 | 0.46 |
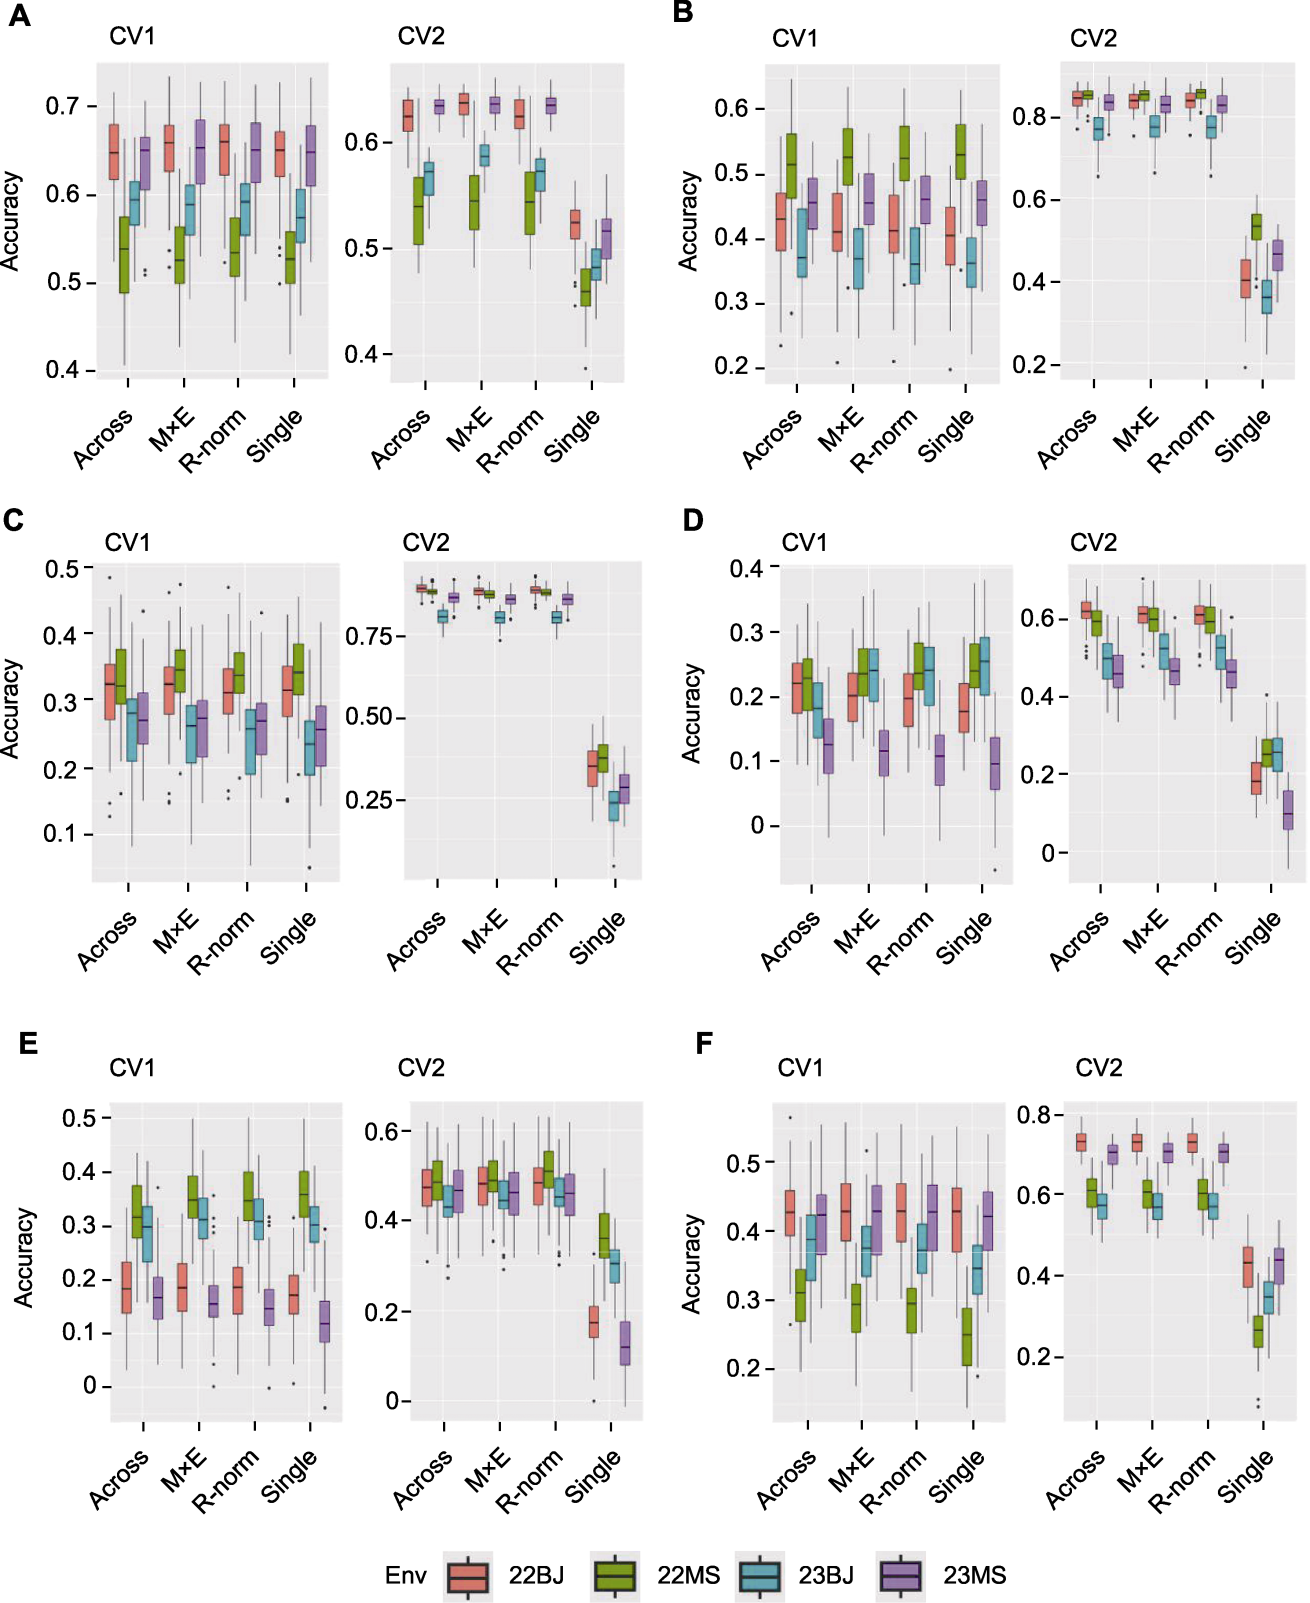
图3 不同性状CV1和CV2不同模型预测值与观测值的相关性 Single模型为利用单环境数据进行预测, Across模型、M×E模型和R-norm模型利用3个环境数据预测剩余1个环境下的表型数据。(A) 散粉期(DTA); (B) 穗位高(EH); (C) 株高(PH); (D) 穗长(EL); (E) 行粒数(KNR); (F) 穗行数(ERN)
Figure 3 Correlation between observed and predicted values of different models of CV1 and CV2 for different traits The Single model uses single-environment data to predict, and the Across model, M×E model and R-norm model use three environmental data to predict phenotypic data in the remaining environment. (A) Days to anthesis (DTA); (B) Ear height (EH); (C) Plant height (PH); (D) Ear length (EL); (E) Kernel number per row (KNR); (F) Ear row number (ERN)
| CV1 | CV2 | ||||||||
|---|---|---|---|---|---|---|---|---|---|
| Single | Across | M×E | R-norm | Single | Across | M×E | R-norm | ||
| DTA | 22BJ | 17.05 | 15.96 | 16.19 | 16.19 | 17.03 | 8.07 | 6.28 | 7.47 |
| 22MS | 49.26 | 49.31 | 48.03 | 48.22 | 47.63 | 34.46 | 33.25 | 33.94 | |
| 23BJ | 29.44 | 28.85 | 28.53 | 28.56 | 29.49 | 19.29 | 16.63 | 18.75 | |
| 23MS | 23.67 | 23.52 | 22.91 | 22.94 | 24.07 | 9.41 | 9.43 | 9.62 | |
| EH | 22BJ | 351.07 | 339.97 | 343.11 | 343.84 | 351.35 | 125.72 | 129.73 | 128.55 |
| 22MS | 388.25 | 400.24 | 384.77 | 384.73 | 377.25 | 164.68 | 162.07 | 158.30 | |
| 23BJ | 237.92 | 232.14 | 233.07 | 233.30 | 237.86 | 144.16 | 133.37 | 134.57 | |
| 23MS | 405.39 | 401.68 | 397.68 | 398.11 | 406.28 | 174.36 | 176.11 | 175.36 | |
| PH | 22BJ | 819.45 | 816.72 | 816.21 | 816.97 | 833.93 | 218.41 | 232.62 | 225.98 |
| 22MS | 786.00 | 787.15 | 780.27 | 780.59 | 784.60 | 214.57 | 224.97 | 216.90 | |
| 23BJ | 468.62 | 470.77 | 469.01 | 470.20 | 468.00 | 223.87 | 216.31 | 217.63 | |
| 23MS | 895.11 | 885.29 | 893.44 | 893.03 | 919.63 | 292.51 | 302.67 | 299.63 | |
| EL | 22BJ | 4.61 | 4.55 | 4.58 | 4.60 | 4.61 | 3.00 | 3.05 | 3.05 |
| 22MS | 3.89 | 3.95 | 3.92 | 3.91 | 3.77 | 2.68 | 2.63 | 2.64 | |
| 23BJ | 4.60 | 4.74 | 4.63 | 4.63 | 4.59 | 3.71 | 3.60 | 3.59 | |
| 23MS | 3.95 | 3.90 | 3.96 | 3.98 | 3.88 | 3.23 | 3.20 | 3.23 | |
| KNR | 22BJ | 2.60 | 2.58 | 2.57 | 2.57 | 2.60 | 1.51 | 1.51 | 1.52 |
| 22MS | 3.67 | 3.53 | 3.58 | 3.58 | 3.57 | 2.46 | 2.47 | 2.47 | |
| 23BJ | 3.09 | 3.00 | 3.01 | 3.01 | 3.08 | 2.52 | 2.49 | 2.49 | |
| 23MS | 3.62 | 3.62 | 3.58 | 3.58 | 3.47 | 2.18 | 2.16 | 2.16 | |
| ERN | 22BJ | 29.68 | 29.41 | 29.60 | 29.59 | 29.65 | 23.72 | 23.80 | 23.64 |
| 22MS | 22.05 | 22.62 | 22.10 | 22.00 | 21.78 | 19.06 | 18.84 | 18.47 | |
| 23BJ | 21.78 | 21.98 | 21.59 | 21.57 | 21.77 | 19.90 | 19.60 | 19.32 | |
| 23MS | 26.27 | 25.70 | 25.90 | 26.09 | 25.12 | 20.06 | 20.02 | 20.11 | |
表4 不同性状CV1和CV2不同模型预测精度均方误差(MSE)分析
Table 4 Mean squared error (MSE) analysis of different models of CV1 and CV2 for different traits
| CV1 | CV2 | ||||||||
|---|---|---|---|---|---|---|---|---|---|
| Single | Across | M×E | R-norm | Single | Across | M×E | R-norm | ||
| DTA | 22BJ | 17.05 | 15.96 | 16.19 | 16.19 | 17.03 | 8.07 | 6.28 | 7.47 |
| 22MS | 49.26 | 49.31 | 48.03 | 48.22 | 47.63 | 34.46 | 33.25 | 33.94 | |
| 23BJ | 29.44 | 28.85 | 28.53 | 28.56 | 29.49 | 19.29 | 16.63 | 18.75 | |
| 23MS | 23.67 | 23.52 | 22.91 | 22.94 | 24.07 | 9.41 | 9.43 | 9.62 | |
| EH | 22BJ | 351.07 | 339.97 | 343.11 | 343.84 | 351.35 | 125.72 | 129.73 | 128.55 |
| 22MS | 388.25 | 400.24 | 384.77 | 384.73 | 377.25 | 164.68 | 162.07 | 158.30 | |
| 23BJ | 237.92 | 232.14 | 233.07 | 233.30 | 237.86 | 144.16 | 133.37 | 134.57 | |
| 23MS | 405.39 | 401.68 | 397.68 | 398.11 | 406.28 | 174.36 | 176.11 | 175.36 | |
| PH | 22BJ | 819.45 | 816.72 | 816.21 | 816.97 | 833.93 | 218.41 | 232.62 | 225.98 |
| 22MS | 786.00 | 787.15 | 780.27 | 780.59 | 784.60 | 214.57 | 224.97 | 216.90 | |
| 23BJ | 468.62 | 470.77 | 469.01 | 470.20 | 468.00 | 223.87 | 216.31 | 217.63 | |
| 23MS | 895.11 | 885.29 | 893.44 | 893.03 | 919.63 | 292.51 | 302.67 | 299.63 | |
| EL | 22BJ | 4.61 | 4.55 | 4.58 | 4.60 | 4.61 | 3.00 | 3.05 | 3.05 |
| 22MS | 3.89 | 3.95 | 3.92 | 3.91 | 3.77 | 2.68 | 2.63 | 2.64 | |
| 23BJ | 4.60 | 4.74 | 4.63 | 4.63 | 4.59 | 3.71 | 3.60 | 3.59 | |
| 23MS | 3.95 | 3.90 | 3.96 | 3.98 | 3.88 | 3.23 | 3.20 | 3.23 | |
| KNR | 22BJ | 2.60 | 2.58 | 2.57 | 2.57 | 2.60 | 1.51 | 1.51 | 1.52 |
| 22MS | 3.67 | 3.53 | 3.58 | 3.58 | 3.57 | 2.46 | 2.47 | 2.47 | |
| 23BJ | 3.09 | 3.00 | 3.01 | 3.01 | 3.08 | 2.52 | 2.49 | 2.49 | |
| 23MS | 3.62 | 3.62 | 3.58 | 3.58 | 3.47 | 2.18 | 2.16 | 2.16 | |
| ERN | 22BJ | 29.68 | 29.41 | 29.60 | 29.59 | 29.65 | 23.72 | 23.80 | 23.64 |
| 22MS | 22.05 | 22.62 | 22.10 | 22.00 | 21.78 | 19.06 | 18.84 | 18.47 | |
| 23BJ | 21.78 | 21.98 | 21.59 | 21.57 | 21.77 | 19.90 | 19.60 | 19.32 | |
| 23MS | 26.27 | 25.70 | 25.90 | 26.09 | 25.12 | 20.06 | 20.02 | 20.11 | |
| Trait | TRN | Model | CV1 | CV2 | Trait | TRN | Model | CV1 | CV2 |
|---|---|---|---|---|---|---|---|---|---|
| DTA | 0.5 | Single | 0.59 | 0.59 | EH | 0.5 | Single | 0.44 | 0.44 |
| 0.5 | Across | 0.60 | 0.78 | 0.5 | Across | 0.45 | 0.82 | ||
| 0.5 | M×E | 0.60 | 0.80 | 0.5 | M×E | 0.44 | 0.82 | ||
| 0.5 | R-norm | 0.61 | 0.79 | 0.5 | R-norm | 0.44 | 0.82 | ||
| 0.7 | Single | 0.62 | 0.63 | 0.7 | Single | 0.47 | 0.46 | ||
| 0.7 | Across | 0.63 | 0.81 | 0.7 | Across | 0.47 | 0.82 | ||
| 0.7 | M×E | 0.63 | 0.83 | 0.7 | M×E | 0.47 | 0.83 | ||
| 0.7 | R-norm | 0.63 | 0.81 | 0.7 | R-norm | 0.47 | 0.83 | ||
| 0.9 | Single | 0.62 | 0.63 | 0.9 | Single | 0.50 | 0.48 | ||
| 0.9 | Across | 0.63 | 0.81 | 0.9 | Across | 0.51 | 0.84 | ||
| 0.9 | M×E | 0.63 | 0.84 | 0.9 | M×E | 0.51 | 0.85 | ||
| 0.9 | R-norm | 0.63 | 0.82 | 0.9 | R-norm | 0.51 | 0.84 | ||
| PH | 0.5 | Single | 0.28 | 0.31 | EL | 0.5 | Single | 0.20 | 0.20 |
| 0.5 | Across | 0.29 | 0.86 | 0.5 | Across | 0.19 | 0.54 | ||
| 0.5 | M×E | 0.29 | 0.85 | 0.5 | M×E | 0.20 | 0.55 | ||
| 0.5 | R-norm | 0.29 | 0.86 | 0.5 | R-norm | 0.20 | 0.55 | ||
| 0.7 | Single | 0.32 | 0.34 | 0.7 | Single | 0.23 | 0.22 | ||
| 0.7 | Across | 0.33 | 0.85 | 0.7 | Across | 0.22 | 0.61 | ||
| 0.7 | M×E | 0.33 | 0.85 | 0.7 | M×E | 0.23 | 0.62 | ||
| 0.7 | R-norm | 0.33 | 0.85 | 0.7 | R-norm | 0.23 | 0.62 | ||
| 0.9 | Single | 0.35 | 0.32 | 0.9 | Single | 0.23 | 0.22 | ||
| 0.9 | Across | 0.37 | 0.85 | 0.9 | Across | 0.23 | 0.61 | ||
| 0.9 | M×E | 0.36 | 0.85 | 0.9 | M×E | 0.24 | 0.62 | ||
| 0.9 | R-norm | 0.36 | 0.85 | 0.9 | R-norm | 0.24 | 0.62 | ||
| KNR | 0.5 | Single | 0.24 | 0.24 | ERN | 0.5 | Single | 0.36 | 0.37 |
| 0.5 | Across | 0.24 | 0.47 | 0.5 | Across | 0.39 | 0.65 | ||
| 0.5 | M×E | 0.26 | 0.47 | 0.5 | M×E | 0.38 | 0.65 | ||
| 0.5 | R-norm | 0.25 | 0.48 | 0.5 | R-norm | 0.38 | 0.65 | ||
| 0.7 | Single | 0.27 | 0.27 | 0.7 | Single | 0.38 | 0.39 | ||
| 0.7 | Across | 0.27 | 0.53 | 0.7 | Across | 0.40 | 0.69 | ||
| 0.7 | M×E | 0.28 | 0.54 | 0.7 | M×E | 0.40 | 0.69 | ||
| 0.7 | R-norm | 0.28 | 0.54 | 0.7 | R-norm | 0.40 | 0.69 | ||
| 0.9 | Single | 0.26 | 0.28 | 0.9 | Single | 0.40 | 0.40 | ||
| 0.9 | Across | 0.26 | 0.55 | 0.9 | Across | 0.42 | 0.70 | ||
| 0.9 | M×E | 0.27 | 0.56 | 0.9 | M×E | 0.42 | 0.70 | ||
| 0.9 | R-norm | 0.27 | 0.57 | 0.9 | R-norm | 0.42 | 0.70 |
表5 CV1和CV2中不同梯度训练集(TRN)占总样本量比例4种模型预测结果
Table 5 Prediction results of four models with different percentage of training populations (TRN) in CV1 and CV2
| Trait | TRN | Model | CV1 | CV2 | Trait | TRN | Model | CV1 | CV2 |
|---|---|---|---|---|---|---|---|---|---|
| DTA | 0.5 | Single | 0.59 | 0.59 | EH | 0.5 | Single | 0.44 | 0.44 |
| 0.5 | Across | 0.60 | 0.78 | 0.5 | Across | 0.45 | 0.82 | ||
| 0.5 | M×E | 0.60 | 0.80 | 0.5 | M×E | 0.44 | 0.82 | ||
| 0.5 | R-norm | 0.61 | 0.79 | 0.5 | R-norm | 0.44 | 0.82 | ||
| 0.7 | Single | 0.62 | 0.63 | 0.7 | Single | 0.47 | 0.46 | ||
| 0.7 | Across | 0.63 | 0.81 | 0.7 | Across | 0.47 | 0.82 | ||
| 0.7 | M×E | 0.63 | 0.83 | 0.7 | M×E | 0.47 | 0.83 | ||
| 0.7 | R-norm | 0.63 | 0.81 | 0.7 | R-norm | 0.47 | 0.83 | ||
| 0.9 | Single | 0.62 | 0.63 | 0.9 | Single | 0.50 | 0.48 | ||
| 0.9 | Across | 0.63 | 0.81 | 0.9 | Across | 0.51 | 0.84 | ||
| 0.9 | M×E | 0.63 | 0.84 | 0.9 | M×E | 0.51 | 0.85 | ||
| 0.9 | R-norm | 0.63 | 0.82 | 0.9 | R-norm | 0.51 | 0.84 | ||
| PH | 0.5 | Single | 0.28 | 0.31 | EL | 0.5 | Single | 0.20 | 0.20 |
| 0.5 | Across | 0.29 | 0.86 | 0.5 | Across | 0.19 | 0.54 | ||
| 0.5 | M×E | 0.29 | 0.85 | 0.5 | M×E | 0.20 | 0.55 | ||
| 0.5 | R-norm | 0.29 | 0.86 | 0.5 | R-norm | 0.20 | 0.55 | ||
| 0.7 | Single | 0.32 | 0.34 | 0.7 | Single | 0.23 | 0.22 | ||
| 0.7 | Across | 0.33 | 0.85 | 0.7 | Across | 0.22 | 0.61 | ||
| 0.7 | M×E | 0.33 | 0.85 | 0.7 | M×E | 0.23 | 0.62 | ||
| 0.7 | R-norm | 0.33 | 0.85 | 0.7 | R-norm | 0.23 | 0.62 | ||
| 0.9 | Single | 0.35 | 0.32 | 0.9 | Single | 0.23 | 0.22 | ||
| 0.9 | Across | 0.37 | 0.85 | 0.9 | Across | 0.23 | 0.61 | ||
| 0.9 | M×E | 0.36 | 0.85 | 0.9 | M×E | 0.24 | 0.62 | ||
| 0.9 | R-norm | 0.36 | 0.85 | 0.9 | R-norm | 0.24 | 0.62 | ||
| KNR | 0.5 | Single | 0.24 | 0.24 | ERN | 0.5 | Single | 0.36 | 0.37 |
| 0.5 | Across | 0.24 | 0.47 | 0.5 | Across | 0.39 | 0.65 | ||
| 0.5 | M×E | 0.26 | 0.47 | 0.5 | M×E | 0.38 | 0.65 | ||
| 0.5 | R-norm | 0.25 | 0.48 | 0.5 | R-norm | 0.38 | 0.65 | ||
| 0.7 | Single | 0.27 | 0.27 | 0.7 | Single | 0.38 | 0.39 | ||
| 0.7 | Across | 0.27 | 0.53 | 0.7 | Across | 0.40 | 0.69 | ||
| 0.7 | M×E | 0.28 | 0.54 | 0.7 | M×E | 0.40 | 0.69 | ||
| 0.7 | R-norm | 0.28 | 0.54 | 0.7 | R-norm | 0.40 | 0.69 | ||
| 0.9 | Single | 0.26 | 0.28 | 0.9 | Single | 0.40 | 0.40 | ||
| 0.9 | Across | 0.26 | 0.55 | 0.9 | Across | 0.42 | 0.70 | ||
| 0.9 | M×E | 0.27 | 0.56 | 0.9 | M×E | 0.42 | 0.70 | ||
| 0.9 | R-norm | 0.27 | 0.57 | 0.9 | R-norm | 0.42 | 0.70 |
| [1] |
Alemu A, Åstrand J, Montesinos-López OA, Isidro Y, Sánchez J, Fernández-Gónzalez J, Tadesse W, Vetukuri RR, Carlsson AS, Ceplitis A, Crossa J, Ortiz R, Chawade A (2024). Genomic selection in plant breeding: key factors shaping two decades of progress. Mol Plant 17, 552-578.
DOI PMID |
| [2] | Burgueño J, De Los Campos G, Weigel K, Crossa J (2012). Genomic prediction of breeding values when modeling genotype × environment interaction using pedigree and dense molecular markers. Crop Sci 52, 707-719. |
| [3] | Carena MJ, Hallauer AR, Filho JBM (2010). Quantitative Genetics in Maize Breeding. New York: Springer Science & Business Media. pp. 1-6. |
| [4] |
Crossa J, De Los Campos G, Pérez P, Gianola D, Burgueño J, Araus JL, Makumbi D, Singh RP, Dreisigacker S, Yan JB, Arief V, Banziger M, Braun HJ (2010). Prediction of genetic values of quantitative traits in plant breeding using pedigree and molecular markers. Genetics 186, 713-724.
DOI PMID |
| [5] | Cuevas J, Crossa J, Soberanis V, Pérez-Elizalde S, Pérez- Rodríguez P, De Los Campos G, Montesinos-López OA, Burgueño J (2016). Genomic prediction of genotype × environment interaction kernel regression models. Plant Genome 9, plantgenome2016. 03.0024. |
| [6] | Ferrão LFV, Ferrão RG, Ferrão MAG, Francisco A, Garcia AAF (2017). A mixed model to multiple harvest-location trials applied to genomic prediction in Coffea canephora. Tree Genet Genomes 13, 95. |
| [7] | Fu JJ, Hao YF, Li HH, Reif JC, Chen SJ, Huang CL, Wang GY, Li XH, Xu YB, Li L (2022). Integration of genomic selection with doubled-haploid evaluation in hybrid breeding: from GS 1.0 to GS 4.0 and beyond. Mol Plant 15, 577-580. |
| [8] |
Hayes BJ, Bowman PJ, Chamberlain AJ, Goddard ME (2009). Invited review: genomic selection in dairy cattle: progress and challenges. J Dairy Sci 92, 433-443.
DOI PMID |
| [9] | Jannink JL, Lorenz AJ, Iwata H (2010). Genomic selection in plant breeding: from theory to practice. Brief Funct Genomics 9, 166-177. |
| [10] |
Jarquín D, Crossa J, Lacaze X, Du Cheyron P, Daucourt J, Lorgeou J, Piraux F, Guerreiro L, Pérez P, Calus M, Burgueño J, De Los Campos G (2014). A reaction norm model for genomic selection using high-dimensional genomic and environmental data. Theor Appl Genet 127, 595-607.
DOI PMID |
| [11] | Jarquin D, Howard R, Crossa J, Beyene Y, Gowda M, Martini JWR, Pazaran GC, Burgueño J, Pacheco A, Grondona M, Wimmer V, Prasanna BM (2020). Genomic prediction enhanced sparse testing for multi-environment trials. G3 (Bethesda) 10, 2725-2739. |
| [12] | Lopez-Cruz M, Crossa J, Bonnett D, Dreisigacker S, Poland J, Jannink JL, Singh RP, Autrique E, De Los Campos G (2015). Increased prediction accuracy in wheat breeding trials using a marker × environment interaction genomic selection model. G3 (Bethesda) 5, 569-582. |
| [13] | Lorenz AJ (2013). Resource allocation for maximizing prediction accuracy and genetic gain of genomic selection in plant breeding: a simulation experiment. G3(Bethesda) 3, 481-491. |
| [14] |
Luo P, Wang HW, Ni ZY, Yang RS, Wang F, Yong HY, Zhang L, Zhou ZQ, Song W, Li MS, Yang J, Weng JF, Meng ZD, Zhang DG, Han JN, Chen Y, Zhang RZ, Wang LW, Zhao M, Gao WW, Chen XY, Li WJ, Hao ZF, Fu JJ, Zhang XC, Li XH (2023). Genomic prediction of yield performance among single-cross maize hybrids using a partial diallel cross design. Crop J 11, 1884-1892.
DOI |
| [15] |
Meuwissen THE, Hayes BJ, Goddard ME (2001). Prediction of total genetic value using genome-wide dense marker maps. Genetics 157, 1819-1829.
DOI PMID |
| [16] |
Pérez P, De Los Campos G (2014). Genome-wide regression and prediction with the BGLR statistical package. Genetics 198, 483-495.
DOI PMID |
| [17] |
Roorkiwal M, Jarquin D, Singh MK, Gaur PM, Bharadwaj C, Rathore A, Howard R, Srinivasan S, Jain A, Garg V, Kale S, Chitikineni A, Tripathi S, Jones E, Robbins KR, Crossa J, Varshney RK (2018). Genomic-enabled prediction models using multi-environment trials to estimate the effect of genotype × environment interaction on predic-tion accuracy in chickpea. Sci Rep 8, 11701.
DOI PMID |
| [18] | Sousa MBE, Cuevas J, de Oliveira Couto EG, Pérez- Rodríguez P, Jarquín D, Fritsche-Neto R, Burgueño J, Crossa J (2017). Genomic-enabled prediction in maize using kernel models with genotype × environment interaction. G3 (Bethesda) 7, 1995-2014. |
| [19] | Terraillon J, Roeber FK, Flachenecker C, Frisch M (2023). Training set designs for prediction of yield and moisture of maize test cross hybrids with unreplicated trials. Front Plant Sci 14, 1080087. |
| [20] |
VanRaden PM (2008). Efficient methods to compute genomic predictions. J Dairy Sci 91, 4414-4423.
DOI PMID |
| [21] |
Wang BB, Lin ZC, Li X, Zhao YP, Zhao BB, Wu GX, Ma XJ, Wang H, Xie YR, Li QQ, Song GS, Kong DX, Zheng ZG, Wei HB, Shen RX, Wu H, Chen CX, Meng ZD, Wang TY, Li Y, Li XH, Chen YH, Lai JS, Hufford MB, Ross-Ibarra J, He H, Wang HY (2020). Genome-wide selection and genetic improvement during modern maize breeding. Nat Genet 52, 565-571.
DOI PMID |
| [22] | Xu YB, Liu XG, Fu JJ, Wang HW, Wang JK, Huang CL, Prasanna BM, Olsen MS, Wang GY, Zhang AM (2019). Enhancing genetic gain through genomic selection: from livestock to plants. Plant Commun 16, 100005. |
| [23] | Yang N, Lu YL, Yang XH, Huang J, Zhou Y, Ali F, Wen WW, Liu J, Li JS, Yan JB (2014). Genome wide association studies using a new nonparametric model reveal the genetic architecture of 17 agronomic traits in an enlarged maize association panel. PLoS Genet 10, e1004573. |
| [24] | Zhu XT, Leiser WL, Hahn V, Würschum T (2021). Training set design in genomic prediction with multiple biparental families. Plant Genome 14, e20124. |
| [1] | 李月琪, 麻仲花, 刘威帆, 苏明, 万猛虎, 李清云, 张丹, 刘吉利, 吴娜. 垂直深旋耕配施有机肥对盐碱地玉米叶片衰老特性及产量的影响[J]. 植物生态学报, 2026, 50(1): 222-236. |
| [2] | 林淼. 玉米雄穗分枝数的激素“密码”[J]. 植物学报, 2026, 61(1): 157-169. |
| [3] | 朱喜, 何志斌, 杜明武, 赵丽雯, 吴丹丹. 2004-2010年河西走廊中段绿洲农田生态系统长期监测样地作物性状和产量数据集[J]. 植物生态学报, 2025, 49(8): 1312-1320. |
| [4] | 王立龙, 冯静, 苏娜, 刘新平, 潘成臣, 李玉强. 2005-2015年科尔沁沙地典型农田生态系统长期监测样地玉米收获期性状和产量数据集[J]. 植物生态学报, 2025, 49(8): 1293-1300. |
| [5] | 王志波, 刘文胜, 吴瑞俊, 王国梁. 2018-2023年黄土高原丘陵沟壑区川台地农田长期监测样地作物收获期性状和产量数据集[J]. 植物生态学报, 2025, 49(8): 1301-1311. |
| [6] | 樊月玲, 蒋正德, 叶佳舒, 郑立臣, 陈欣. 2005-2015年下辽河平原农田长期观测样地主要农作物收获期性状和产量数据集[J]. 植物生态学报, 2025, 49(8): 1271-1282. |
| [7] | 杜庆国, 李文学. lncRNA调控玉米生长发育和非生物胁迫研究进展[J]. 植物学报, 2024, 59(6): 950-962. |
| [8] | 王子阳, 刘升学, 杨志蕊, 秦峰. 玉米抗旱性的遗传解析[J]. 植物学报, 2024, 59(6): 883-902. |
| [9] | 吴锁伟, 安学丽, 万向元. 玉米雄性不育机理及其在工程核不育制种中的应用[J]. 植物学报, 2024, 59(6): 932-949. |
| [10] | 郑名敏, 黄强, 张鹏, 刘孝伟, 赵卓凡, 易洪杨, 荣廷昭, 曹墨菊. 玉米细胞质雄性不育及育性恢复研究进展[J]. 植物学报, 2024, 59(6): 999-1006. |
| [11] | 杨娟, 赵月磊, 陈晓远, 王宝宝, 王海洋. 玉米开花期调控机理及育种应用[J]. 植物学报, 2024, 59(6): 912-931. |
| [12] | 闫恒宇, 李朝霞, 李玉斌. 高温对玉米生长的影响及中国耐高温玉米筛选研究进展[J]. 植物学报, 2024, 59(6): 1007-1023. |
| [13] | 王涛, 冯敬磊, 张翠. 高温胁迫影响玉米生长发育的分子机制研究进展[J]. 植物学报, 2024, 59(6): 963-977. |
| [14] | 张强, 赵振宇, 李平华. 基因编辑技术在玉米中的研究进展[J]. 植物学报, 2024, 59(6): 978-998. |
| [15] | 杨文丽, 李钊, 刘志铭, 张志华, 杨今胜, 吕艳杰, 王永军. 不同熟期玉米叶片衰老特性及其对叶际细菌的影响[J]. 植物学报, 2024, 59(6): 1024-1040. |
| 阅读次数 | ||||||
|
全文 |
|
|||||
|
摘要 |
|
|||||
 首页
首页