
Chinese Bulletin of Botany ›› 2016, Vol. 51 ›› Issue (2): 226-234.DOI: 10.11983/CBB15055 cstr: 32102.14.CBB15055
• EXPERIMENTAL COMMUNICATIONS • Previous Articles Next Articles
Ying Liu1, Baozhang Chen1,2,*( ), Jing Chen2, Guang Xu2,3
Received:2015-03-31
Accepted:2015-09-21
Online:2016-03-01
Published:2016-03-31
Contact:
E-mail: Ying Liu, Baozhang Chen, Jing Chen, Guang Xu. Applicability of Evapotranspiration Simulation Models for Forest Ecosystems in Qianyanzhou[J]. Chinese Bulletin of Botany, 2016, 51(2): 226-234.
| Year | Screening interval (%) | ||||
|---|---|---|---|---|---|
| 0.2-1.8 | 0.3-1.7 | 0.4-1.6 | 0.5-1.5 | 0.6-1.4 | |
| 2003 | 62.23 | 58.19 | 53.69 | 47.93 | 41.13 |
| 2004 | 64.88 | 60.73 | 55.70 | 49.72 | 42.61 |
| 2005 | 38.34 | 34.02 | 29.44 | 24.76 | 20.01 |
| 2006 | 51.16 | 45.75 | 40.35 | 34.44 | 28.12 |
| 2007 | 60.33 | 55.88 | 50.45 | 44.19 | 37.65 |
Table 1 Available quantity of data for 2003-2007 based on the principle of conservation energy
| Year | Screening interval (%) | ||||
|---|---|---|---|---|---|
| 0.2-1.8 | 0.3-1.7 | 0.4-1.6 | 0.5-1.5 | 0.6-1.4 | |
| 2003 | 62.23 | 58.19 | 53.69 | 47.93 | 41.13 |
| 2004 | 64.88 | 60.73 | 55.70 | 49.72 | 42.61 |
| 2005 | 38.34 | 34.02 | 29.44 | 24.76 | 20.01 |
| 2006 | 51.16 | 45.75 | 40.35 | 34.44 | 28.12 |
| 2007 | 60.33 | 55.88 | 50.45 | 44.19 | 37.65 |
| Month | Models | |||||||
|---|---|---|---|---|---|---|---|---|
| P-T | B-C | H-S | J-H | Ham | Tu | Ma | Th | |
| 1 | 1.213 | 0.353 | 0.003 | 2.151 | 0.078 | 0.022 | 0.550 | 8.113 |
| 2 | 0.991 | 0.350 | 0.003 | 1.225 | 0.068 | 0.019 | 0.520 | 8.113 |
| 3 | 0.888 | 0.381 | 0.003 | 0.998 | 0.070 | 0.018 | 0.482 | 8.113 |
| 4 | 0.790 | 0.415 | 0.003 | 0.901 | 0.070 | 0.020 | 0.546 | 8.113 |
| 5 | 0.863 | 0.499 | 0.003 | 0.931 | 0.077 | 0.024 | 0.668 | 8.113 |
| 6 | 0.872 | 0.526 | 0.003 | 0.914 | 0.076 | 0.026 | 0.707 | 8.113 |
| 7 | 0.932 | 0.606 | 0.004 | 0.995 | 0.080 | 0.031 | 0.862 | 0.940 |
| 8 | 0.883 | 0.561 | 0.004 | 0.993 | 0.077 | 0.029 | 0.816 | 0.940 |
| 9 | 0.886 | 0.526 | 0.004 | 1.073 | 0.080 | 0.025 | 0.722 | 8.113 |
| 10 | 0.929 | 0.407 | 0.003 | 1.072 | 0.068 | 0.021 | 0.625 | 8.113 |
| 11 | 1.072 | 0.357 | 0.003 | 1.248 | 0.065 | 0.020 | 0.604 | 8.113 |
| 12 | 1.204 | 0.357 | 0.003 | 2.069 | 0.076 | 0.020 | 0.561 | 8.113 |
| Sd | 0.1353 | 0.0928 | 0.0004 | 0.4329 | 0.0051 | 0.0042 | 0.1192 | 2.792 |
| Mean | 0.9602 | 0.4448 | 0.0031 | 1.2142 | 0.0737 | 0.0230 | 0.6385 | 6.917 |
| CV (%) | 14.089 | 20.874 | 13.547 | 35.653 | 6.948 | 18.254 | 18.671 | 40.363 |
Table 2 Model parameter (α), standard deviation (Sd), mean and coefficient variation (CV) using the least square method
| Month | Models | |||||||
|---|---|---|---|---|---|---|---|---|
| P-T | B-C | H-S | J-H | Ham | Tu | Ma | Th | |
| 1 | 1.213 | 0.353 | 0.003 | 2.151 | 0.078 | 0.022 | 0.550 | 8.113 |
| 2 | 0.991 | 0.350 | 0.003 | 1.225 | 0.068 | 0.019 | 0.520 | 8.113 |
| 3 | 0.888 | 0.381 | 0.003 | 0.998 | 0.070 | 0.018 | 0.482 | 8.113 |
| 4 | 0.790 | 0.415 | 0.003 | 0.901 | 0.070 | 0.020 | 0.546 | 8.113 |
| 5 | 0.863 | 0.499 | 0.003 | 0.931 | 0.077 | 0.024 | 0.668 | 8.113 |
| 6 | 0.872 | 0.526 | 0.003 | 0.914 | 0.076 | 0.026 | 0.707 | 8.113 |
| 7 | 0.932 | 0.606 | 0.004 | 0.995 | 0.080 | 0.031 | 0.862 | 0.940 |
| 8 | 0.883 | 0.561 | 0.004 | 0.993 | 0.077 | 0.029 | 0.816 | 0.940 |
| 9 | 0.886 | 0.526 | 0.004 | 1.073 | 0.080 | 0.025 | 0.722 | 8.113 |
| 10 | 0.929 | 0.407 | 0.003 | 1.072 | 0.068 | 0.021 | 0.625 | 8.113 |
| 11 | 1.072 | 0.357 | 0.003 | 1.248 | 0.065 | 0.020 | 0.604 | 8.113 |
| 12 | 1.204 | 0.357 | 0.003 | 2.069 | 0.076 | 0.020 | 0.561 | 8.113 |
| Sd | 0.1353 | 0.0928 | 0.0004 | 0.4329 | 0.0051 | 0.0042 | 0.1192 | 2.792 |
| Mean | 0.9602 | 0.4448 | 0.0031 | 1.2142 | 0.0737 | 0.0230 | 0.6385 | 6.917 |
| CV (%) | 14.089 | 20.874 | 13.547 | 35.653 | 6.948 | 18.254 | 18.671 | 40.363 |
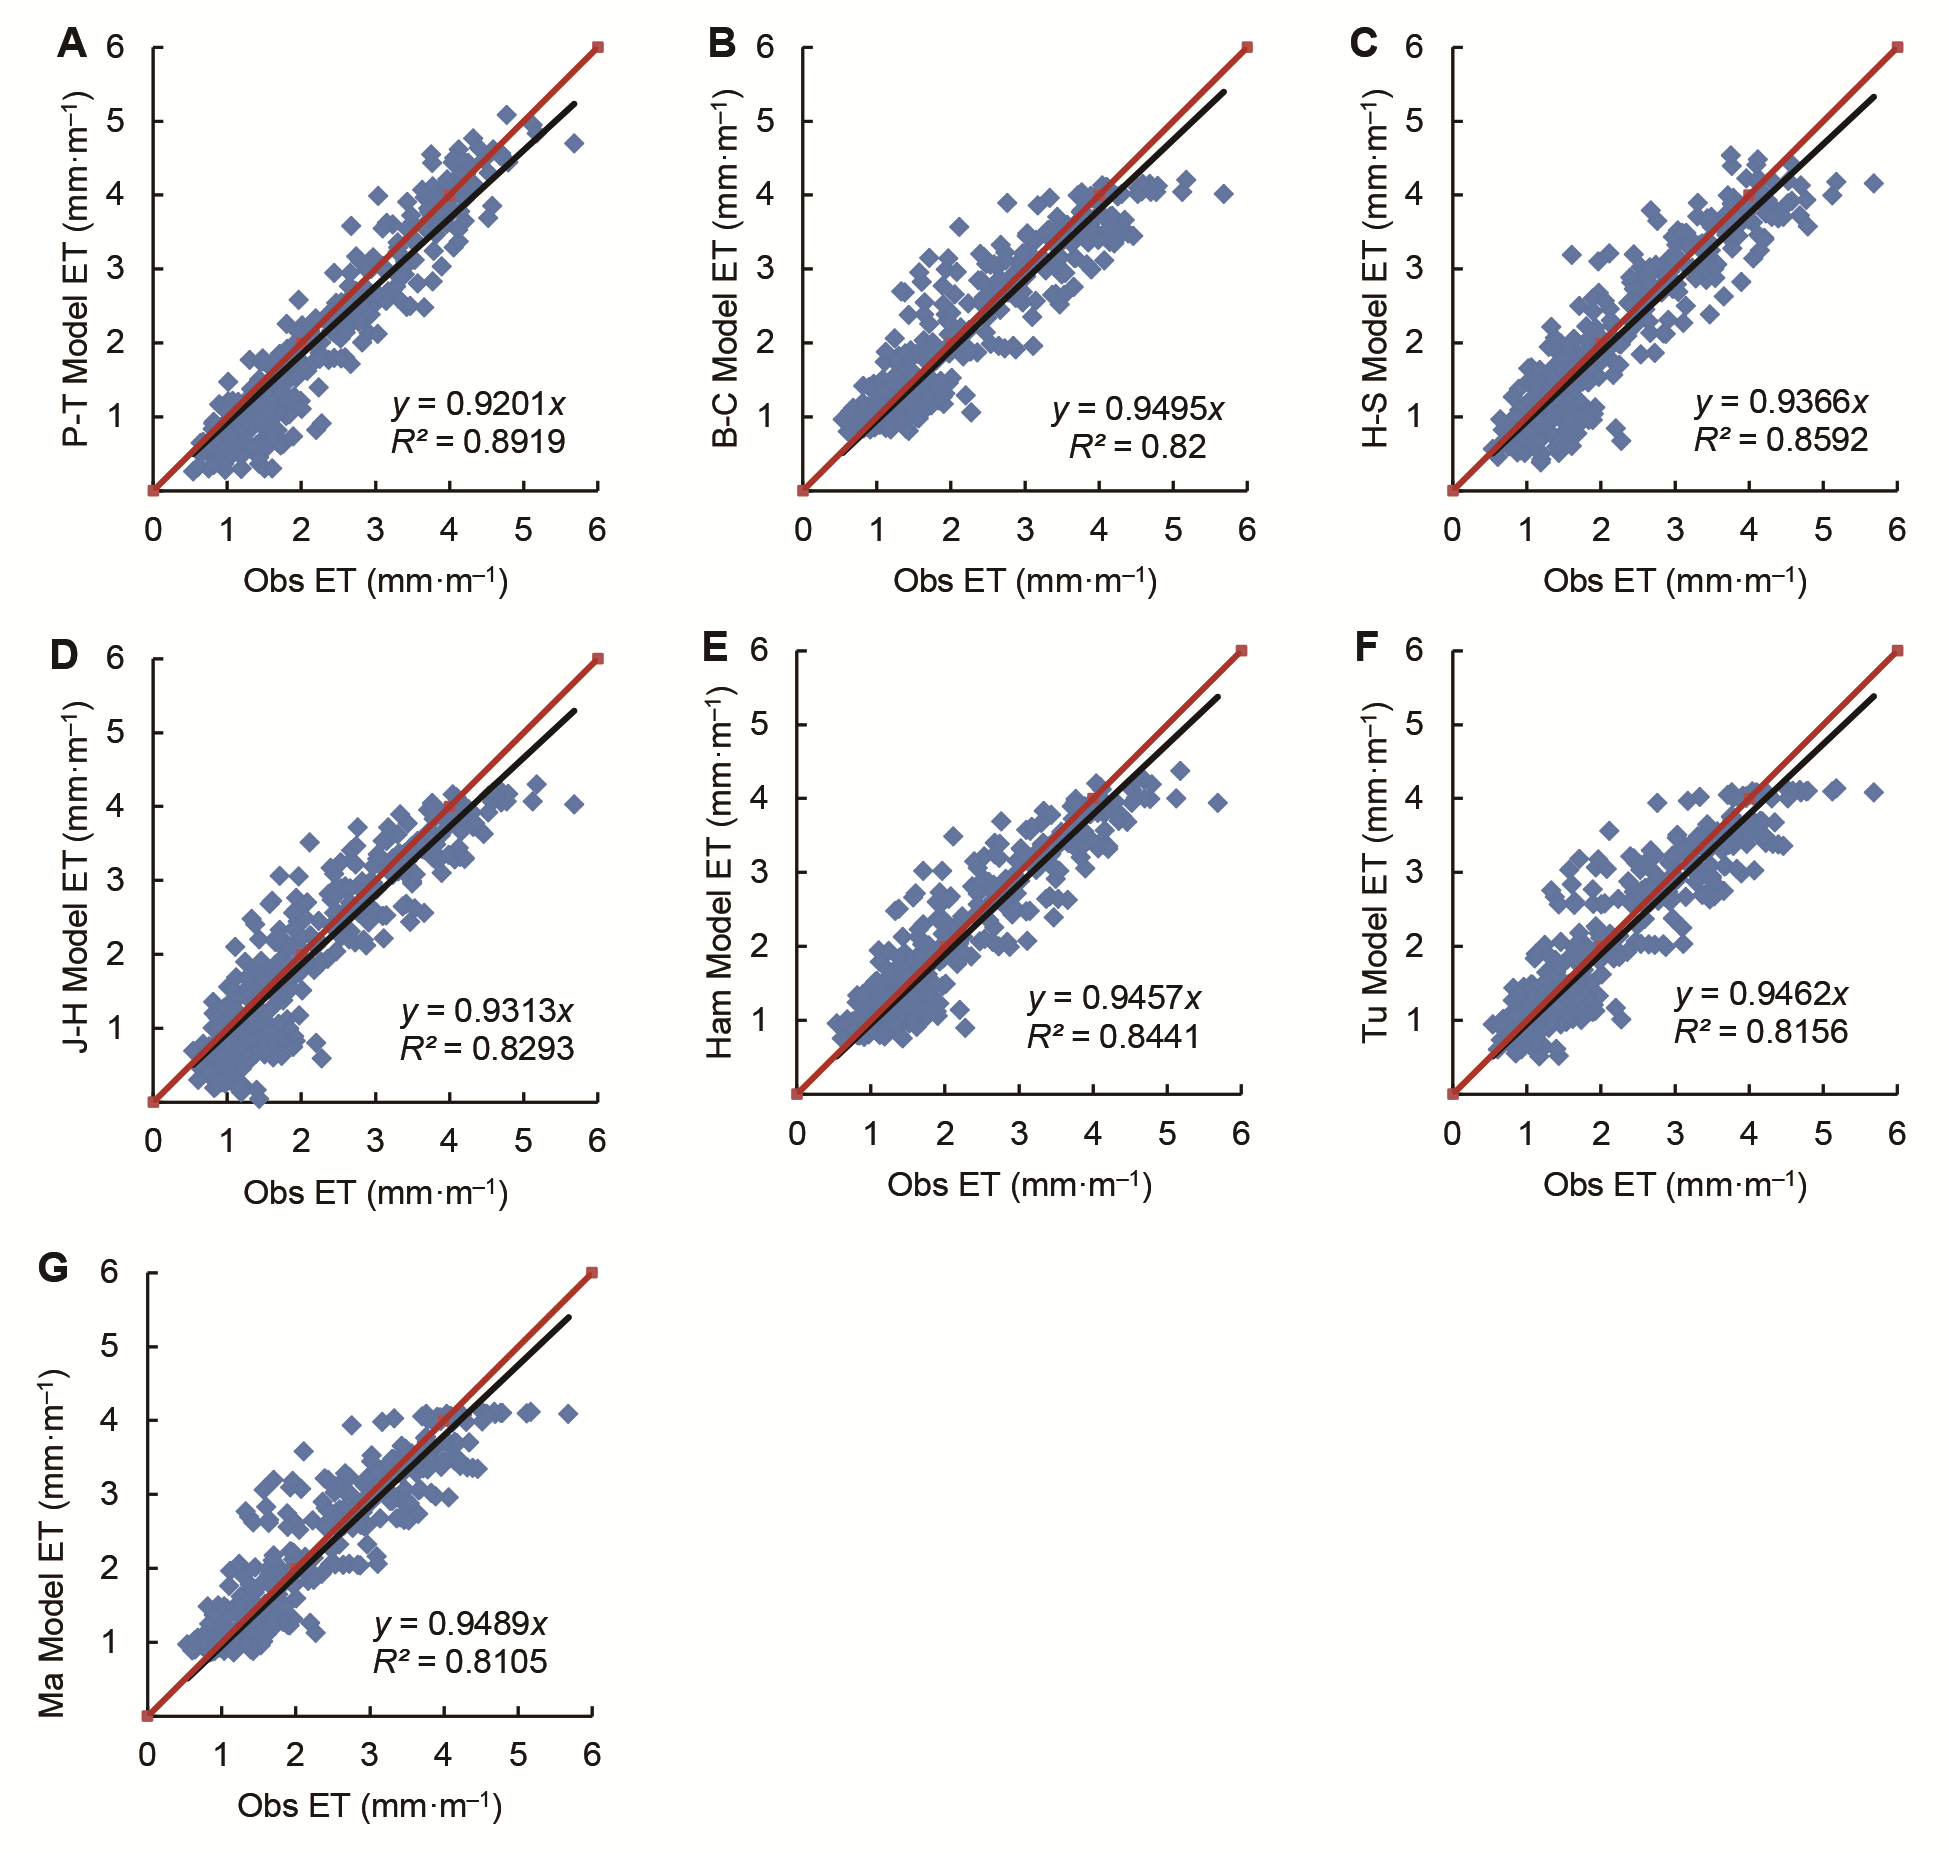
Figure 1 Daily evapotrans piration (ET) observation and ET simulation on average of years (A)-(G) The fitting prctures of P-T, B-C, H-S, J-H, Ham, Tu and Ma model, respectively. Abscissa represents observation; Ordinate represents simulation; R2 represents goodness of fit.
| Model | RMSE | MBE | R |
|---|---|---|---|
| P-T | 0.456 | 0.355 | 0.953** |
| B-C | 0.458 | 0.342 | 0.917** |
| H-S | 0.453 | 0.343 | 0.927** |
| J-H | 0.512 | 0.399 | 0.911** |
| Ham | 0.439 | 0.332 | 0.925** |
| Tu | 0.476 | 0.362 | 0.910** |
| Ma | 0.467 | 0.348 | 0.913** |
Table 3 Correlation analysis of daily evapotranspiration (ET) observation and ET simulation on average
| Model | RMSE | MBE | R |
|---|---|---|---|
| P-T | 0.456 | 0.355 | 0.953** |
| B-C | 0.458 | 0.342 | 0.917** |
| H-S | 0.453 | 0.343 | 0.927** |
| J-H | 0.512 | 0.399 | 0.911** |
| Ham | 0.439 | 0.332 | 0.925** |
| Tu | 0.476 | 0.362 | 0.910** |
| Ma | 0.467 | 0.348 | 0.913** |
| Coefficient | Obs | Model | |||||||
|---|---|---|---|---|---|---|---|---|---|
| P-T | B-C | H-S | J-H | Ham | Tu | Ma | Th | ||
| Sd | 33.337 | 34.987 | 33.174 | 34.383 | 36.171 | 33.158 | 33.962 | 33.165 | 48.385 |
| Mean | 68.045 | 65.514 | 66.629 | 64.011 | 63.319 | 65.891 | 66.078 | 66.701 | 64.885 |
| CV (%) | 48.992 | 57.858 | 49.790 | 53.714 | 57.125 | 50.322 | 51.397 | 49.722 | 74.570 |
Table 4 Monthly change of evapotranspiration (ET) observation and ET simulation of years (mm·m-1)
| Coefficient | Obs | Model | |||||||
|---|---|---|---|---|---|---|---|---|---|
| P-T | B-C | H-S | J-H | Ham | Tu | Ma | Th | ||
| Sd | 33.337 | 34.987 | 33.174 | 34.383 | 36.171 | 33.158 | 33.962 | 33.165 | 48.385 |
| Mean | 68.045 | 65.514 | 66.629 | 64.011 | 63.319 | 65.891 | 66.078 | 66.701 | 64.885 |
| CV (%) | 48.992 | 57.858 | 49.790 | 53.714 | 57.125 | 50.322 | 51.397 | 49.722 | 74.570 |
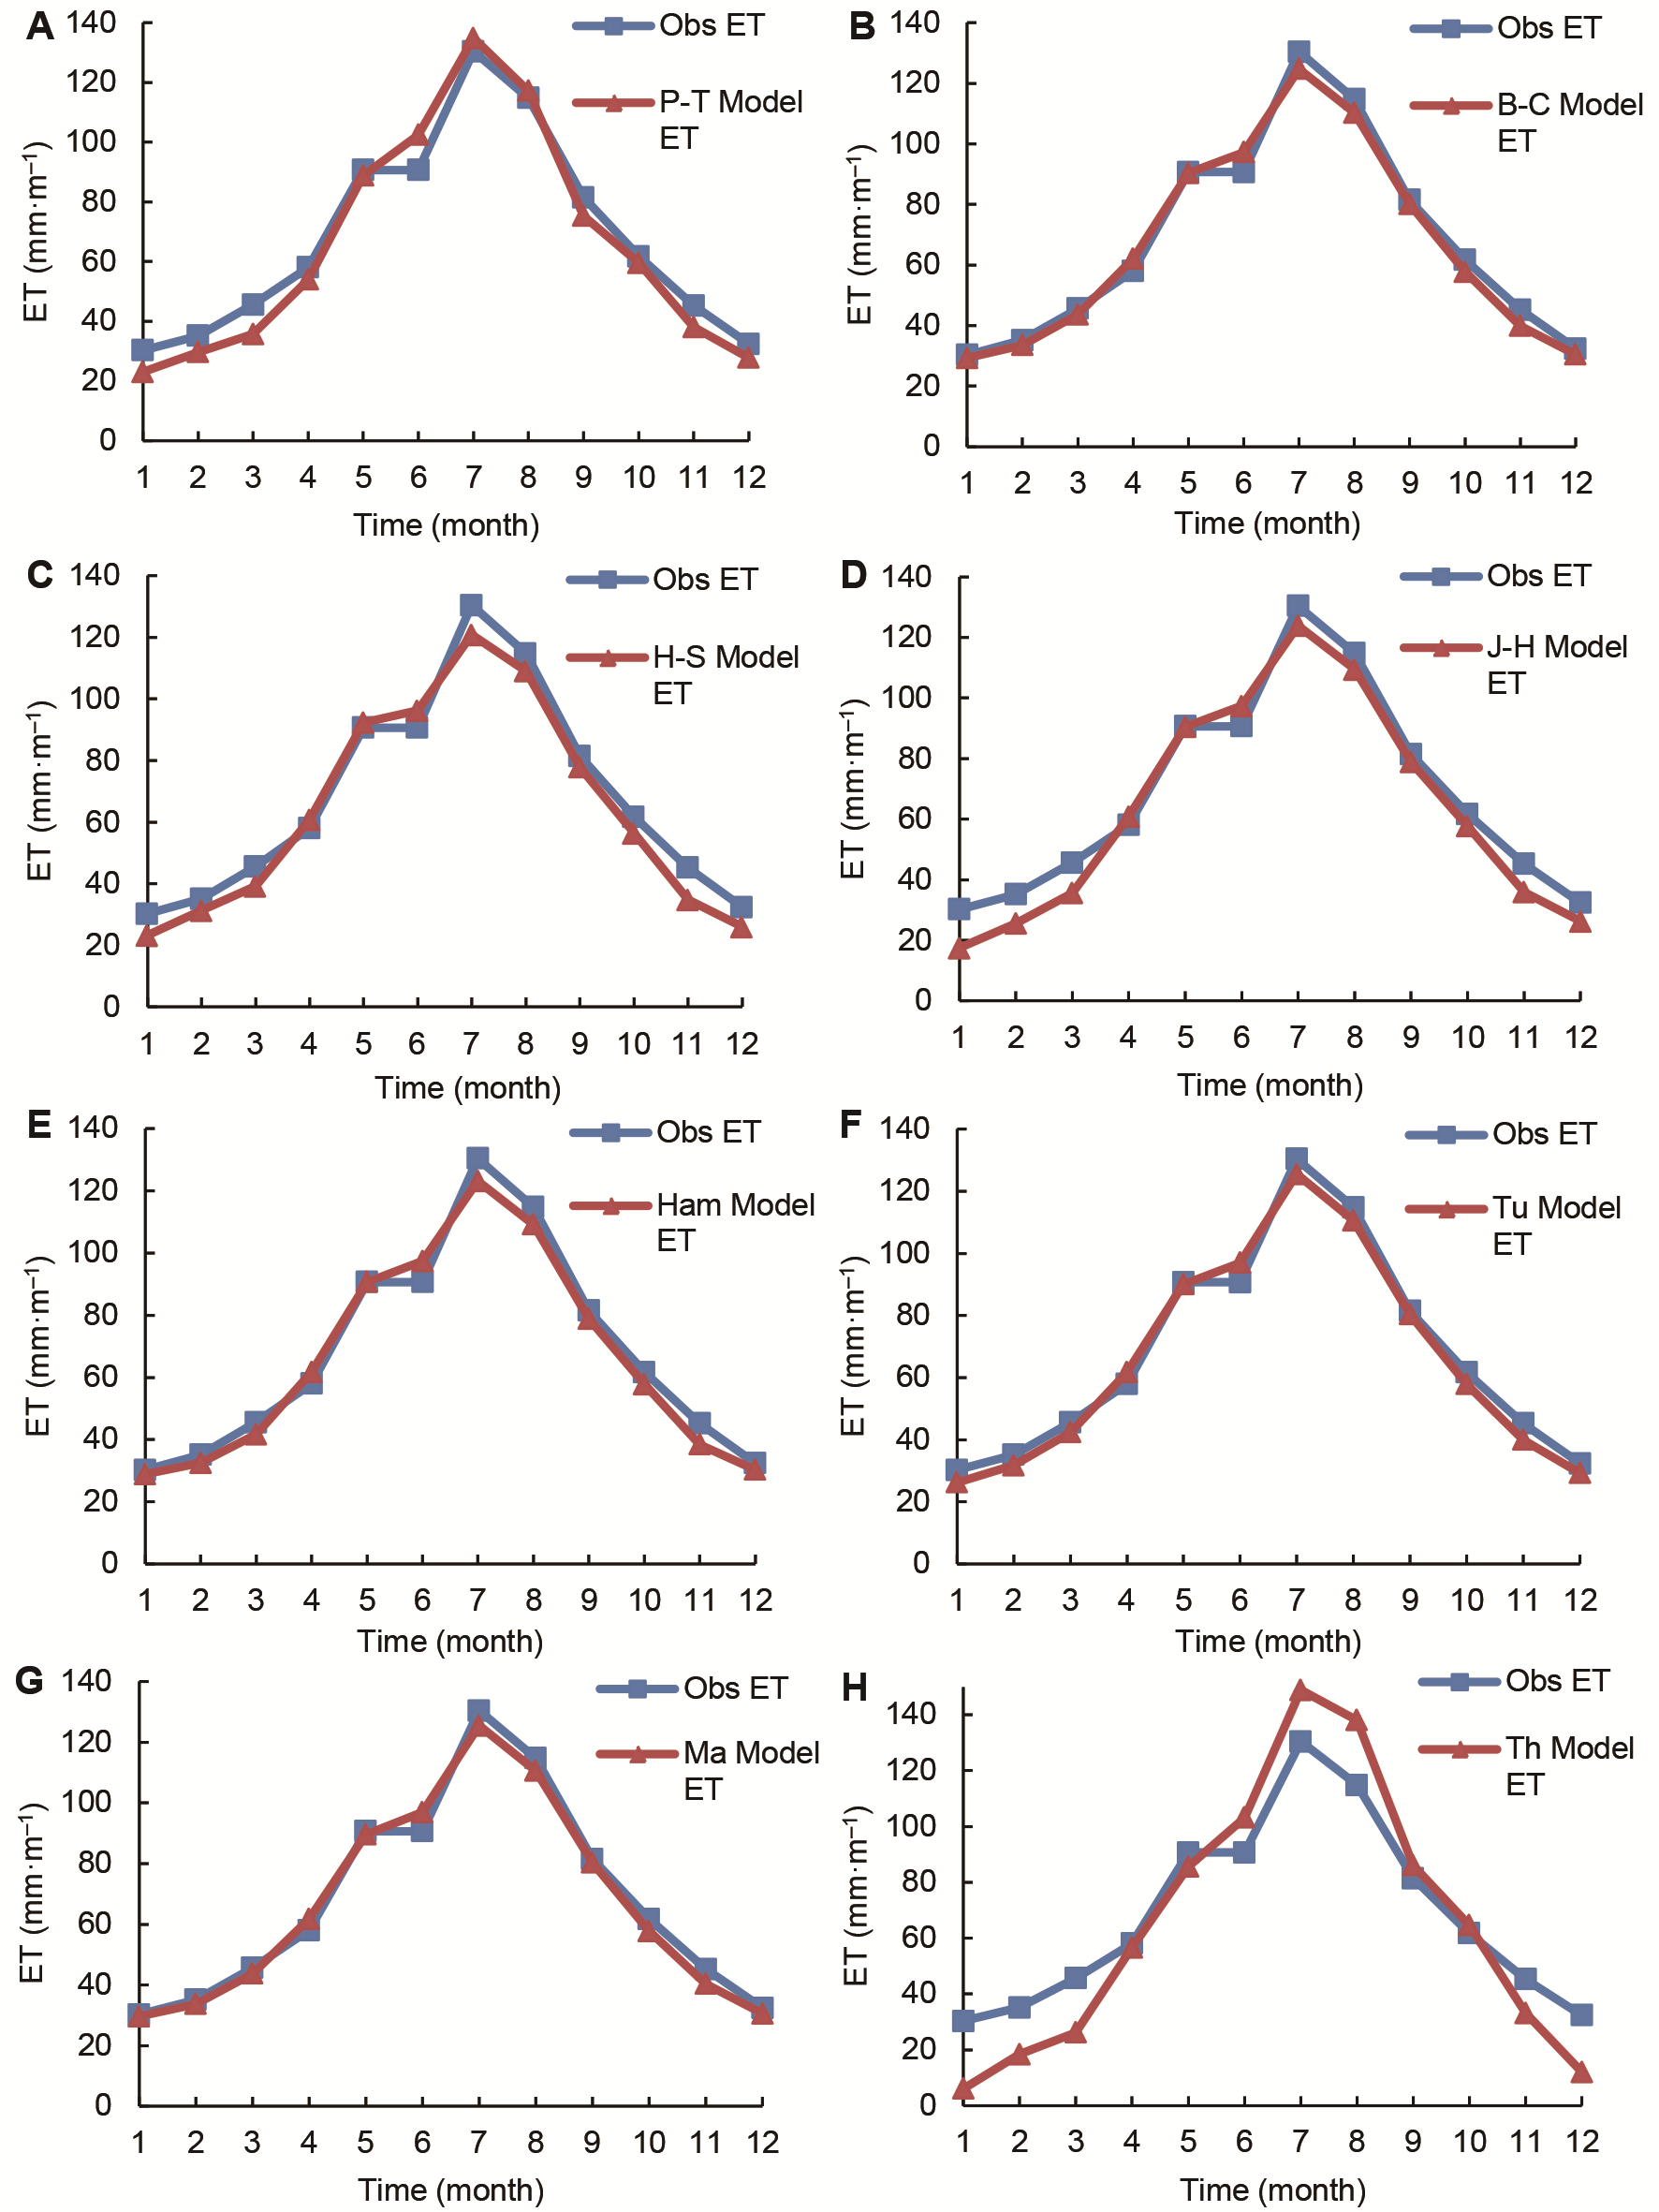
Figure 2 Comparison of monthly evapotranspiration (ET) observation and ET simulation of years on average (A) The picture of monthly variation between observation and P-T model simulation; (B) The picture of monthly variation between observation and B-C model simulation; (C) The picture of monthly variation between observation and H-S model simulation; (D) The picture of monthly variation between observation and J-H model simulation; (E) The picture of monthly variation between observation and Ham model simulation; (F) The picture of monthly variation between observation and Tu model simulation; (G) The picture of monthly variation between observation and Ma model simulation; (H) The picture of monthly variation between observation and Th model simulation
| Model | RMSE | MBE | R |
|---|---|---|---|
| P-T | 6.337 | 5.621 | 0.994** |
| B-C | 3.752 | 3.179 | 0.994** |
| H-S | 6.198 | 5.685 | 0.990** |
| J-H | 7.203 | 6.306 | 0.990** |
| Ham | 4.468 | 3.881 | 0.992** |
| Tu | 3.931 | 3.632 | 0.995** |
| Ma | 3.495 | 2.999 | 0.995** |
| Th | 15.559 | 13.436 | 0.992** |
Table 5 Monthly evapotranspiration (ET) observation and ET simulation on average of years
| Model | RMSE | MBE | R |
|---|---|---|---|
| P-T | 6.337 | 5.621 | 0.994** |
| B-C | 3.752 | 3.179 | 0.994** |
| H-S | 6.198 | 5.685 | 0.990** |
| J-H | 7.203 | 6.306 | 0.990** |
| Ham | 4.468 | 3.881 | 0.992** |
| Tu | 3.931 | 3.632 | 0.995** |
| Ma | 3.495 | 2.999 | 0.995** |
| Th | 15.559 | 13.436 | 0.992** |
| Rn | Ts | Ta | RH | Ws | Pvapor | Rainfall | n | |
|---|---|---|---|---|---|---|---|---|
| R | 0.951** | 0.877** | 0.900** | -0.326** | 0.371** | 0.891** | 0.061 | 0.799** |
Table 6 Correlation coefficient (R) of meteorological factor and evapotranspiration (ET) observation under Person correlation test
| Rn | Ts | Ta | RH | Ws | Pvapor | Rainfall | n | |
|---|---|---|---|---|---|---|---|---|
| R | 0.951** | 0.877** | 0.900** | -0.326** | 0.371** | 0.891** | 0.061 | 0.799** |
| Rn | Ts | Ta | RH | Ws | Pvapor | n | |
|---|---|---|---|---|---|---|---|
| R | 0.733** | 0.300** | -0.412** | -0.206** | 0.308** | 0.334** | -0.24 |
Table 7 Correlation coefficient of meteorological factor and evapotranspiration (ET) observation under partial correlation analysis
| Rn | Ts | Ta | RH | Ws | Pvapor | n | |
|---|---|---|---|---|---|---|---|
| R | 0.733** | 0.300** | -0.412** | -0.206** | 0.308** | 0.334** | -0.24 |
| [1] | 程根伟, 余新晓, 赵玉涛, 周杨明, 罗辑 (2003). 贡嘎山亚高山森林带蒸散特征模拟研究. 北京林业大学学报 25(1), 23-27. |
| [2] | 杜加强, 熊珊珊, 刘成程, 郭杨, 舒俭民, 张林波 (2013). 黄河上游地区几种参考作物蒸散量计算方法的适用性比较. 干旱区地理 36, 831-840. |
| [3] | 胡兴波, 芦新建, 董梅, 连利叶, 贺康宁 (2013). 简化参照作物蒸散量(ET0)计算公式在青海省高寒区的适用性分析. 西北农林科技大学学报(自然科学版) 41(11),201-208. |
| [4] | 李菲菲, 饶良懿, 吕琨珑, 李会杰, 宋丹丹 (2012). Priestley- Taylor模型参数修正及在蒸散发估算中的应用. 浙江农林大学学报 30, 748-754. |
| [5] | 李玉霖, 崔建垣, 张铜会 (2002). 参考作物蒸散量计算方法的比较研究. 中国沙漠 22, 372-376. |
| [6] | 王昊, 许士国, 孙砳石 (2007). 扎龙湿地参照作物蒸散发估算的经验模型. 水科学进展 18, 246-251. |
| [7] | 王梅, 王建波 (2005). 森林内气象因素和蒸散发的观测实验. 黑龙江水专学报 32(2), 21-22, 25. |
| [8] |
杨贵军, 黄文江, 王纪华, 邢著荣 (2010). 多源多角度遥感数据反演森林叶面积指数方法. 植物学报 45, 566-578.
DOI |
| [9] | 张晓琳, 熊立华, 林琳, 龙海峰 (2012). 五种潜在蒸散发公式在汉江流域的应用. 干旱区地理 35, 229-237. |
| [10] | Allen RG, Pereira LS, Dirk R, Martin S (1998). Crop Evapotranspiration:Guidelines for Computing Crop Water Requirements. Rome: Natural Resources Management and Environment Press. pp. 56. |
| [11] | Blaney HF, Criddle WD (1962). Determining consumptive use and irrigation water requirements. Technical Bull 25, 369-373. |
| [12] | Bonan GB (2008). Ecological Climatology:Concepts and Applications. Cambridge: Cambridge University Press. pp. 31. |
| [13] | Chen B, Ge Q, Fu D, Yu G, Sun X, Wang S, Wang H (2010). A data-model fusion approach for upscaling gross ecosystem productivity to the landscape scale based on remote sensing and flux footprint modelling. Biogeo- sciences 7, 2943-2958. |
| [14] | Chen J, Chen BZ, Black TA, Innes JL, Wang GY, Kiely G, Hirano T, Wohlfahrt G (2013). Comparison of terres- trial evapotranspiration estimates using the mass transfer and Penman-Monteith equations in land surface models. J Geophys Res 118, 1715-1731. |
| [15] | Douglas E, Jennifer MJ, Summer DS, Ram LR (2009). A comparison of models for estimating potential evapo- transpiration for Florida land cover types. J Hydrol 373, 366-376. |
| [16] | Fisher JB, Whittaker RJ, Malhi Y (2011). ET come home: potential evapotranspiration in geographical ecology. Global Ecol Biogeogr 20, 1-18. |
| [17] | Hargreaves GH, Samani ZA (1985). Reference crop evapo- transpiration from temperature. Appl Eng Agric 1, 96-99. |
| [18] | Lu JB, Sun G, Mcnulty SG, Amatya DM (2005). A com- parison of six potential evapotranspiration methods for regional use in the southeastern US. J Am Water Works Assn 41, 621-633. |
| [19] | Loukas A, Vasiliades L, Domenikiotis C, Dalezios NR (2005). Basin-wide actual evapotranspiration estimation using NOAA/AVHRR satellite data. Phys Chem Earth 30, 69-79. |
| [20] | Pereira AR, Pruitt WO (2004). Adaptation of the Thorn- thwaite scheme for estimating daily reference evapora- tion. Agr Water Manage 66, 251-257. |
| [21] | Priestly CHB, Taylor RJ (1972). On the assessment of surface heat flux and evaporation using large-scale parameters. Mon Weather Rev 100(2), 81-92. |
| [22] | Trajkovic S, Kolakovic S (2009). Evaluation of reference evapotranspiration equations under humid conditions. Water Resour Manag 23, 3057-3067. |
| [23] | Xu CY, Singh VP (2005). Evaluation of three compl- ementary relationship evapotranspiration models by water balance approach to estimate actual regional evapo- transpiration in different climatic regions. J Hydrol 308, 105-121. |
| [24] | Zha TS, Barr AG, van der Kamp G, Black TA, McCaughey JH, Flanagan LB (2010). Interannual variation of evapo- transpiration from forest and grassland ecosystems in western Canada in relation to drought. Agric For Meteorol 150, 1476-1484. |
| [1] | 李 佳泽, 贾 德彬, 郝 玉胜, 郝 帅, 尚 紫琴, 纪 明宇. Diurnal Variation of Oxygen Isotopes and Quantitative Partitioning of Evapotranspiration in the Larix gmelinii Ecosystem in the Greater Khingan Mountains of Inner Mongolia [J]. , 2026, 50(预发表): 0-. |
| [2] | Dexi Zhang, Qian Zhou, Xuezhu Pei, Hongyong Zhang, Yingtai Pei, Shan Sun, Mingxin Liu, Lixun Zhang, Changming Zhao. Dataset of arthropod specimen images and DNA barcodes in forest ecosystem of the Xinglong Mountains of Gansu Province [J]. Biodiv Sci, 2026, 34(4): 25409-. |
| [3] | FANG Di, MA Ning, LI Sheng-Gong, ZHENG Jia-Jia, CHU Yun-Xin, YANG Jin-Chang, YANG Zan-Ming, ZHANG Long-Ning, MENG Sheng-Wang, GAO De-Cai, DAI Xiao-Qin, FU Xiao-Li, WANG Hui-Min, KOU Liang. Regulatory role of mycorrhizal types in internal nutrient cycling of forest ecosystems [J]. Chin J Plant Ecol, 2026, 50(3): 552-565. |
| [4] | RAN Jia-Xin, HE Shu-Ting, LUO Su-Ping, WANG Yun, MAO Chao. Global patterns and drivers of soil gross nitrogen transformations of forest ecosystems [J]. Chin J Plant Ecol, 2026, 50(1): 45-54. |
| [5] | Siyu Liu, Chunhuan Li, Yumei Pan, Xiuhai Zhao, Chunyu Zhang, Naili Zhang. Influence of ectomycorrhizal tree dominance on seedling recruitment in temperate forests at different successional stages [J]. Biodiv Sci, 2025, 33(9): 25268-. |
| [6] | ZHAO Meng-Yang, ZHUANG Hao-Ran, XU De-Hao, MA Guo-Rong, MA Yong-Cheng, FENG Ke-Peng. Hydrogen and oxygen stable isotope characteristics of maize fields in arid and semi-arid oasis irrigation areas with SPAC system: variability traits and influencing factors [J]. Chin J Plant Ecol, 2025, 49(2): 256-267. |
| [7] | ZHU Wan-Kuan, XU Yu-Xing, HUANG Run-Xia, DU A-Peng, WANG Zhi-Chao. Differences in water use efficiency between dry and rainy seasons and their controlling factors in Eucalyptus plantation in Leizhou Peninsula [J]. Chin J Plant Ecol, 2025, 49(12): 2015-2029. |
| [8] | WANG Yin, TONG Xiao-Juan, ZHANG Jin-Song, LI Jun, MENG Ping, LIU Pei-Rong, ZHANG Jing-Ru. Impact of drought on carbon and water fluxes and their coupling in a Quercus variabilis plantation [J]. Chin J Plant Ecol, 2024, 48(9): 1157-1171. |
| [9] | Xinyi He, Yumei Pan, Yan Zhu, Jiayi Chen, Sirong Zhang, Naili Zhang. Impact of ectomycorrhizal tree dominance and species richness on soil nitrogen turnover in a warm temperate forest [J]. Biodiv Sci, 2024, 32(9): 24173-. |
| [10] | HUANG Li-Cheng, MO Xing-Guo. Response and resilience of net primary productivity of the Hai River Basin ecosystems under meteorological droughts [J]. Chin J Plant Ecol, 2024, 48(10): 1256-1273. |
| [11] | HAN Cong, MU Yan-Mei, ZHA Tian-Shan, QIN Shu-Gao, LIU Peng, TIAN Yun, JIA Xin. A dataset of ecosystem fluxes in a shrubland ecosystem of Mau Us Sandy Land in Yanchi, Ningxia, China (2012-2016) [J]. Chin J Plant Ecol, 2023, 47(9): 1322-1332. |
| [12] | ZHANG Zhong-Yang, SONG Xi-Qiang, REN Ming-Xun, ZHANG Zhe. Ecological functions of vascular epiphytes in habitat construction [J]. Chin J Plant Ecol, 2023, 47(7): 895-911. |
| [13] | WANG Xiu-Ying, CHEN Qi, DU Hua-Li, ZHANG Rui, MA Hong-Lu. Evapotranspiration interpolation in alpine marshes wetland on the Qingzang Plateau based on machine learning [J]. Chin J Plant Ecol, 2023, 47(7): 912-921. |
| [14] | ZHANG Yao, CHEN Lan, WANG Jie-Ying, LI Yi, WANG Jun, GUO Yao-Xin, REN Cheng-Jie, BAI Hong-Ying, SUN Hao-Tian, ZHAO Fa-Zhu. Differences and influencing factors of microbial carbon use efficiency in forest rhizosphere soils at different altitudes in Taibai Mountain, China [J]. Chin J Plant Ecol, 2023, 47(2): 275-288. |
| [15] | ZHU Yu-Ying, ZHANG Hua-Min, DING Ming-Jun, YU Zi-Ping. Changes of vegetation greenness and its response to drought-wet variation on the Qingzang Plateau [J]. Chin J Plant Ecol, 2023, 47(1): 51-64. |
| Viewed | ||||||
|
Full text |
|
|||||
|
Abstract |
|
|||||
 Home
Home