
Chinese Bulletin of Botany ›› 2021, Vol. 56 ›› Issue (6): 722-731.DOI: 10.11983/CBB21064 cstr: 32102.14.CBB21064
• TECHNIQUES AND METHODS • Previous Articles Next Articles
Qing Miao, Pa-he-er-ding Sabiha, Siyu Zeng, Qifang Pan( )
)
Received:2021-04-17
Accepted:2021-09-17
Online:2021-11-01
Published:2021-11-12
Contact:
Qifang Pan
Qing Miao, Pa-he-er-ding Sabiha, Siyu Zeng, Qifang Pan. Green Extraction Method and Optimization of Steviosides from Stevia rebaudiana by Natural Deep Eutectic Solvent[J]. Chinese Bulletin of Botany, 2021, 56(6): 722-731.
| No. | Component 1 | Component 2 | Component 3 | Mole ratio (v/v) |
|---|---|---|---|---|
| NADES-1 | 1,2-propanediol | Glycerol | Water | 8:1:1 |
| NADES-2 | 1,2-propanediol | Glycerol | Water | 1:1:1 |
| NADES-3 | 1,2-propanediol | Glucose | Lactic acid | 3:1:5 |
| NADES-4 | 1,2-propanediol | Water | 2:1 | |
| NADES-5 | 1,2-propanediol | Glycerol | 1:2 | |
| NADES-6 | Glycerol | Water | 9:1 |
Table 1 Different combinations of natural deep eutectic solvents
| No. | Component 1 | Component 2 | Component 3 | Mole ratio (v/v) |
|---|---|---|---|---|
| NADES-1 | 1,2-propanediol | Glycerol | Water | 8:1:1 |
| NADES-2 | 1,2-propanediol | Glycerol | Water | 1:1:1 |
| NADES-3 | 1,2-propanediol | Glucose | Lactic acid | 3:1:5 |
| NADES-4 | 1,2-propanediol | Water | 2:1 | |
| NADES-5 | 1,2-propanediol | Glycerol | 1:2 | |
| NADES-6 | Glycerol | Water | 9:1 |
| No. | 1 | 2 | 3 | 4 | 5 | 6 |
|---|---|---|---|---|---|---|
| Stevioside (mg∙mL-1) | 4 | 2 | 1 | 0.5 | 0.25 | 0.125 |
| Rebaudioside A (mg∙mL-1) | 3 | 1.5 | 0.75 | 0.375 | 0.1875 | 0.09375 |
Table 2 Standard solution concentration
| No. | 1 | 2 | 3 | 4 | 5 | 6 |
|---|---|---|---|---|---|---|
| Stevioside (mg∙mL-1) | 4 | 2 | 1 | 0.5 | 0.25 | 0.125 |
| Rebaudioside A (mg∙mL-1) | 3 | 1.5 | 0.75 | 0.375 | 0.1875 | 0.09375 |
| Level | Factor | ||
|---|---|---|---|
| A: Temperature (°C) | B: Power (J∙s-1) | C: Time (min) | |
| -1 | 60 | 50 | 30 |
| 0 | 70 | 65 | 60 |
| 1 | 80 | 80 | 90 |
Table 3 Factors and levels of response surface methodology
| Level | Factor | ||
|---|---|---|---|
| A: Temperature (°C) | B: Power (J∙s-1) | C: Time (min) | |
| -1 | 60 | 50 | 30 |
| 0 | 70 | 65 | 60 |
| 1 | 80 | 80 | 90 |
| Time (min) | Mobile phase C (%) | Mobile phase B (%) |
|---|---|---|
| 0 | 80 | 20 |
| 3 | 80 | 20 |
| 15 | 30 | 70 |
| 20 | 30 | 70 |
| 20.1 | 80 | 20 |
| 27 | 80 | 20 |
Table 4 Gradient elution procedure
| Time (min) | Mobile phase C (%) | Mobile phase B (%) |
|---|---|---|
| 0 | 80 | 20 |
| 3 | 80 | 20 |
| 15 | 30 | 70 |
| 20 | 30 | 70 |
| 20.1 | 80 | 20 |
| 27 | 80 | 20 |
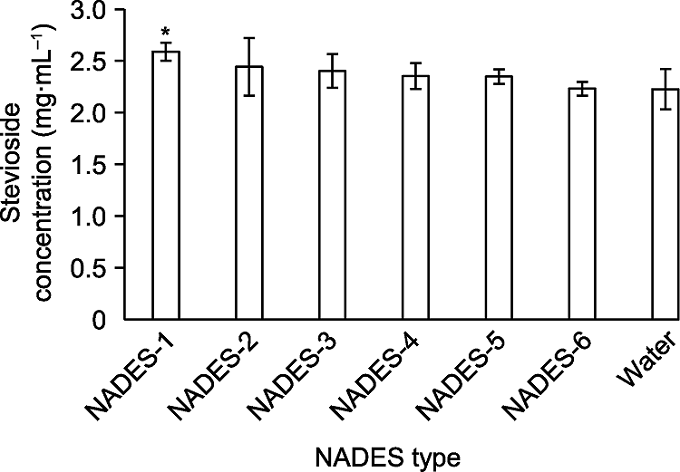
Figure 1 Extraction concentration of stevioside in different solvents * P<0.05; NADES-1-6 are shown in Table 1.
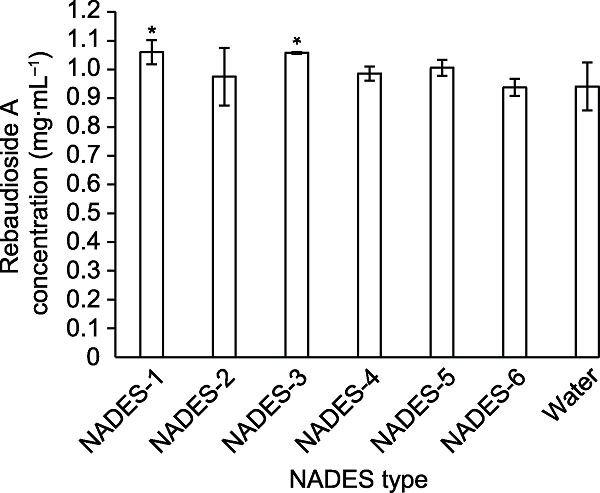
Figure 2 Extraction concentration of rebaudioside A in dif- ferent solvents * P<0.05; NADES-1-6 are shown in Table 1.
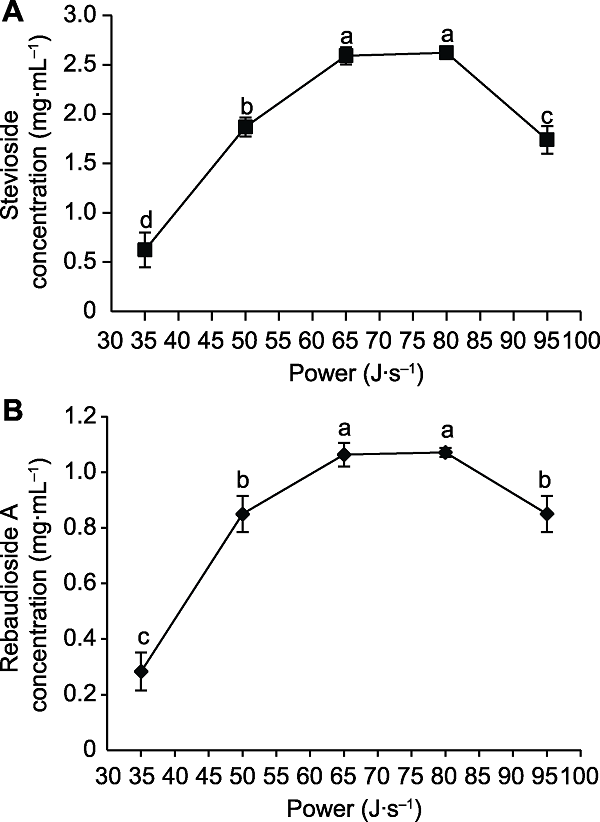
Figure 3 The effects of ultrasonic power on the concentration of stevioside (A) and rebaudioside A (B) Different lowercase letters indicate significant differences (P< 0.05).
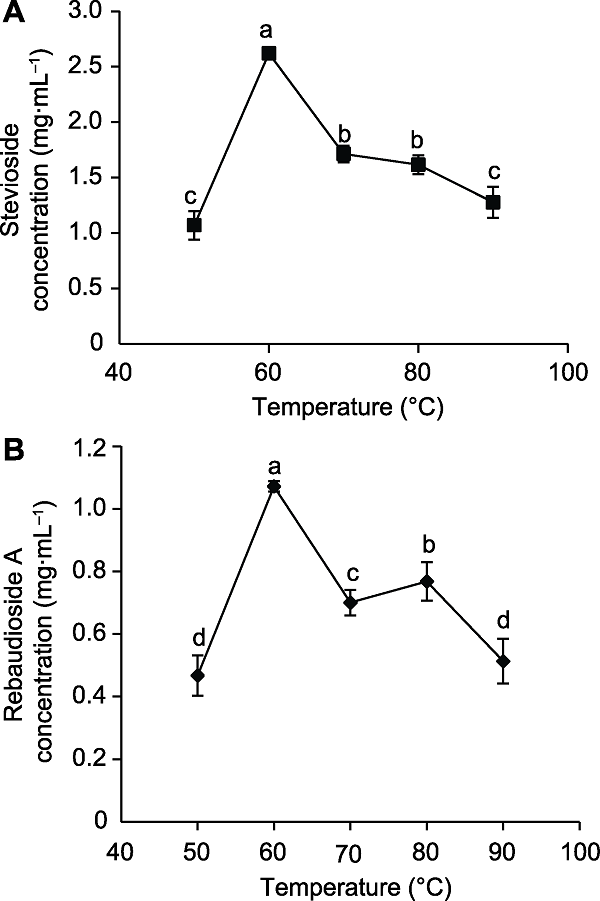
Figure 4 The effects of extraction temperature on the concentration of stevioside (A) and rebaudioside A (B) Different lowercase letters indicate significant differences (P< 0.05).
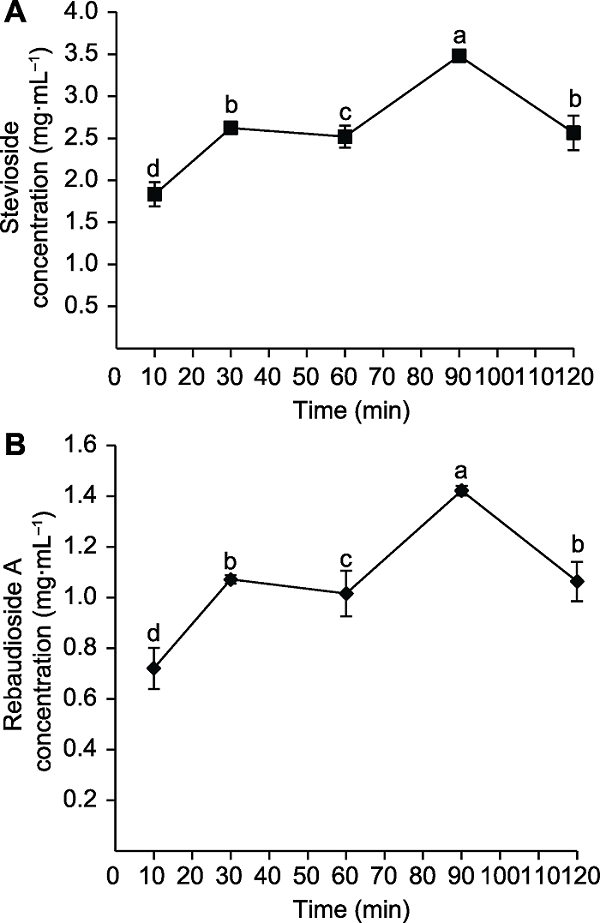
Figure 5 The effects of extraction time on the concentration of stevioside (A) and rebaudioside A (B) Different lowercase letters indicate significant differences (P< 0.05).
| Run units | A: Tempe- rature (°C) | B: Power (J∙s-1) | C: Time (min) | Stevioside concentration (mg∙mL-1) | Rebaudioside A concentration (mg∙mL-1) |
|---|---|---|---|---|---|
| 1 | 70 | 50 | 30 | 2.30 | 1.11 |
| 2 | 80 | 65 | 90 | 2.08 | 0.90 |
| 3 | 70 | 80 | 90 | 2.77 | 1.03 |
| 4 | 70 | 50 | 90 | 0.11 | 0.09 |
| 5 | 70 | 80 | 30 | 1.71 | 0.70 |
| 6 | 60 | 65 | 90 | 2.57 | 1.18 |
| 7 | 60 | 65 | 30 | 2.59 | 1.06 |
| 8 | 80 | 80 | 60 | 2.00 | 0.83 |
| 9 | 60 | 80 | 60 | 2.52 | 1.02 |
| 10 | 70 | 65 | 60 | 1.52 | 0.64 |
| 11 | 70 | 65 | 60 | 1.52 | 0.64 |
| 12 | 70 | 65 | 60 | 1.52 | 0.64 |
| 13 | 80 | 50 | 60 | 0.06 | 0.02 |
| 14 | 70 | 65 | 60 | 1.52 | 0.64 |
| 15 | 70 | 65 | 60 | 1.52 | 0.64 |
| 16 | 80 | 65 | 30 | 1.31 | 0.65 |
| 17 | 60 | 50 | 60 | 0.49 | 0.35 |
Table 5 Response surface experimental results
| Run units | A: Tempe- rature (°C) | B: Power (J∙s-1) | C: Time (min) | Stevioside concentration (mg∙mL-1) | Rebaudioside A concentration (mg∙mL-1) |
|---|---|---|---|---|---|
| 1 | 70 | 50 | 30 | 2.30 | 1.11 |
| 2 | 80 | 65 | 90 | 2.08 | 0.90 |
| 3 | 70 | 80 | 90 | 2.77 | 1.03 |
| 4 | 70 | 50 | 90 | 0.11 | 0.09 |
| 5 | 70 | 80 | 30 | 1.71 | 0.70 |
| 6 | 60 | 65 | 90 | 2.57 | 1.18 |
| 7 | 60 | 65 | 30 | 2.59 | 1.06 |
| 8 | 80 | 80 | 60 | 2.00 | 0.83 |
| 9 | 60 | 80 | 60 | 2.52 | 1.02 |
| 10 | 70 | 65 | 60 | 1.52 | 0.64 |
| 11 | 70 | 65 | 60 | 1.52 | 0.64 |
| 12 | 70 | 65 | 60 | 1.52 | 0.64 |
| 13 | 80 | 50 | 60 | 0.06 | 0.02 |
| 14 | 70 | 65 | 60 | 1.52 | 0.64 |
| 15 | 70 | 65 | 60 | 1.52 | 0.64 |
| 16 | 80 | 65 | 30 | 1.31 | 0.65 |
| 17 | 60 | 50 | 60 | 0.49 | 0.35 |
| Source | Sum of squares | Degree of freedom | Mean square | F value | P-value |
|---|---|---|---|---|---|
| Model | 9.98 | 9 | 1.11 | 8.00 | 0.0060** |
| A: Temperature | 0.9351 | 1 | 0.9351 | 6.75 | 0.0355* |
| B: Power | 4.58 | 1 | 4.58 | 33.08 | 0.0007** |
| C: Time | 0.0188 | 1 | 0.0188 | 0.1355 | 0.7237 |
| AB | 0.0018 | 1 | 0.0018 | 0.0128 | 0.9130 |
| AC | 0.1520 | 1 | 0.1520 | 1.10 | 0.3297 |
| BC | 2.64 | 1 | 2.64 | 19.09 | 0.0033** |
| A² | 0.0265 | 1 | 0.0265 | 0.1910 | 0.6752 |
| B² | 0.4768 | 1 | 0.4768 | 3.44 | 0.1059 |
| C² | 1.21 | 1 | 1.21 | 8.71 | 0.0214* |
| Residual | 0.9697 | 7 | 0.1385 | ||
| Lack of fit | 0.9697 | 3 | 0.3232 | ||
| Pure error | 0.0000 | 4 | 0.0000 | ||
| Cor total | 10.95 | 16 | |||
| R2 | 0.9114 | ||||
| Radj2 | 0.7975 | ||||
| Rpred2 | -0.4173 | ||||
| Adeq precision | 10.9996 |
Table 6 Analysis of the model variances of stevioside concentration
| Source | Sum of squares | Degree of freedom | Mean square | F value | P-value |
|---|---|---|---|---|---|
| Model | 9.98 | 9 | 1.11 | 8.00 | 0.0060** |
| A: Temperature | 0.9351 | 1 | 0.9351 | 6.75 | 0.0355* |
| B: Power | 4.58 | 1 | 4.58 | 33.08 | 0.0007** |
| C: Time | 0.0188 | 1 | 0.0188 | 0.1355 | 0.7237 |
| AB | 0.0018 | 1 | 0.0018 | 0.0128 | 0.9130 |
| AC | 0.1520 | 1 | 0.1520 | 1.10 | 0.3297 |
| BC | 2.64 | 1 | 2.64 | 19.09 | 0.0033** |
| A² | 0.0265 | 1 | 0.0265 | 0.1910 | 0.6752 |
| B² | 0.4768 | 1 | 0.4768 | 3.44 | 0.1059 |
| C² | 1.21 | 1 | 1.21 | 8.71 | 0.0214* |
| Residual | 0.9697 | 7 | 0.1385 | ||
| Lack of fit | 0.9697 | 3 | 0.3232 | ||
| Pure error | 0.0000 | 4 | 0.0000 | ||
| Cor total | 10.95 | 16 | |||
| R2 | 0.9114 | ||||
| Radj2 | 0.7975 | ||||
| Rpred2 | -0.4173 | ||||
| Adeq precision | 10.9996 |
| Source | Sum of squares | Degree of freedom | Mean square | F value | P-value |
|---|---|---|---|---|---|
| Model | 1.51 | 9 | 0.1682 | 4.53 | 0.0294* |
| A: Temperature | 0.1834 | 1 | 0.1834 | 4.94 | 0.0616 |
| B: Power | 0.4988 | 1 | 0.4988 | 13.45 | 0.0080** |
| C: Time | 0.0126 | 1 | 0.0126 | 0.3396 | 0.5783 |
| AB | 0.0044 | 1 | 0.0044 | 0.1185 | 0.7408 |
| AC | 0.0040 | 1 | 0.0040 | 0.1083 | 0.7517 |
| BC | 0.4567 | 1 | 0.4567 | 12.31 | 0.0099** |
| A² | 0.0173 | 1 | 0.0173 | 0.4660 | 0.5168 |
| B² | 0.0951 | 1 | 0.0951 | 2.56 | 0.1534 |
| C² | 0.2538 | 1 | 0.2538 | 6.84 | 0.0346* |
| Residual | 0.2597 | 7 | 0.0371 | ||
| Lack of fit | 0.2597 | 3 | 0.0866 | ||
| Pure error | 0.0000 | 4 | 0.0000 | ||
| Cor total | 1.77 | 16 | |||
| R2 | 0.8536 | ||||
| Radj2 | 0.6653 | ||||
| Rpred2 | -1.3429 | ||||
| Adeq precision | 7.9551 |
Table 7 Analysis of the model variances of rebaudioside A concentration
| Source | Sum of squares | Degree of freedom | Mean square | F value | P-value |
|---|---|---|---|---|---|
| Model | 1.51 | 9 | 0.1682 | 4.53 | 0.0294* |
| A: Temperature | 0.1834 | 1 | 0.1834 | 4.94 | 0.0616 |
| B: Power | 0.4988 | 1 | 0.4988 | 13.45 | 0.0080** |
| C: Time | 0.0126 | 1 | 0.0126 | 0.3396 | 0.5783 |
| AB | 0.0044 | 1 | 0.0044 | 0.1185 | 0.7408 |
| AC | 0.0040 | 1 | 0.0040 | 0.1083 | 0.7517 |
| BC | 0.4567 | 1 | 0.4567 | 12.31 | 0.0099** |
| A² | 0.0173 | 1 | 0.0173 | 0.4660 | 0.5168 |
| B² | 0.0951 | 1 | 0.0951 | 2.56 | 0.1534 |
| C² | 0.2538 | 1 | 0.2538 | 6.84 | 0.0346* |
| Residual | 0.2597 | 7 | 0.0371 | ||
| Lack of fit | 0.2597 | 3 | 0.0866 | ||
| Pure error | 0.0000 | 4 | 0.0000 | ||
| Cor total | 1.77 | 16 | |||
| R2 | 0.8536 | ||||
| Radj2 | 0.6653 | ||||
| Rpred2 | -1.3429 | ||||
| Adeq precision | 7.9551 |
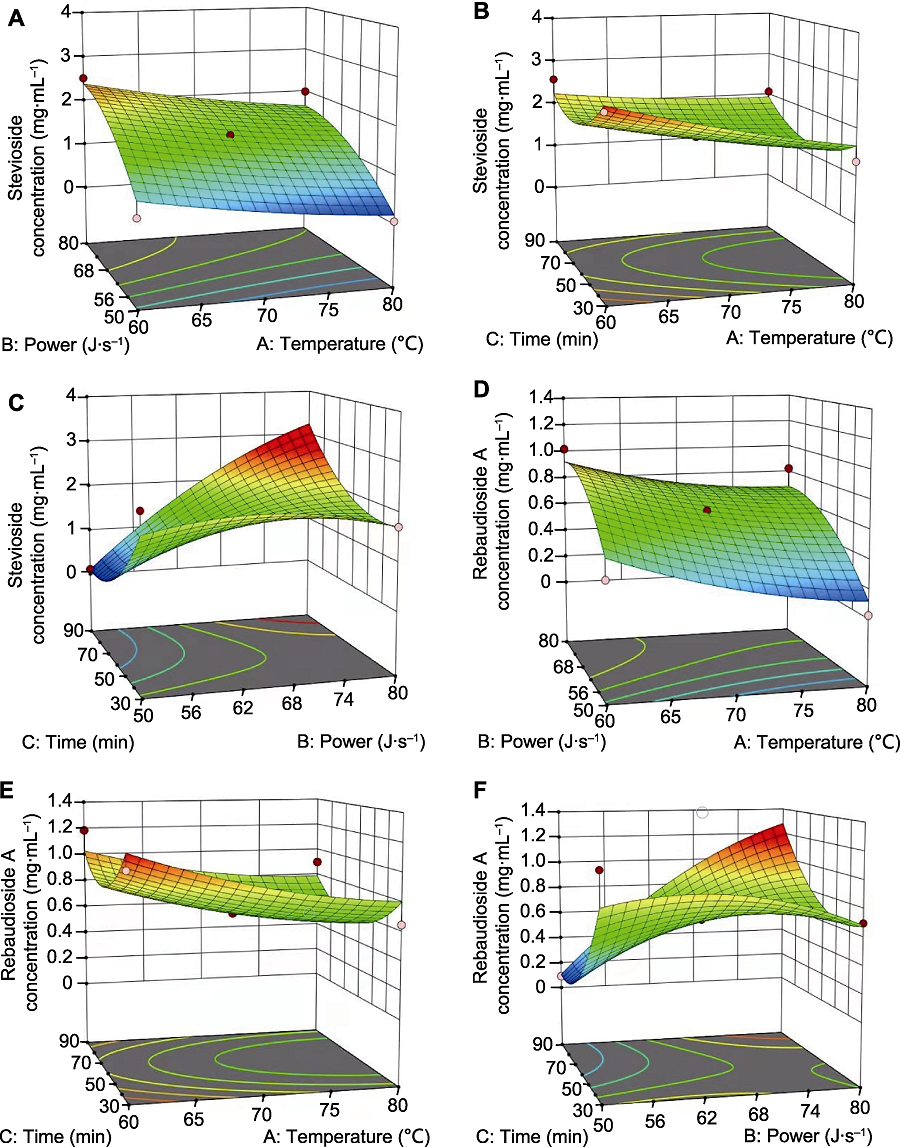
Figure 6 Response surface analysis of extraction temperature, ultrasonic power and extraction time for stevioside and rebaudioside A (A) Response surface (3D) showing effect of temperature and power on stevioside; (B) Response surface (3D) showing effect of temperature and time on stevioside; (C) Response surface (3D) showing effect of power and time on stevioside; (D) Response surface (3D) showing effect of temperature and power on rebaudioside A; (E) Response surface (3D) showing effect of temperature and time on rebaudioside A; (F) Response surface (3D) showing effect of power and time on rebaudioside A
| Temperature (°C) | Power (J∙s-1) | Time (min) | Stevioside concentration (mg∙mL-1) | Rebaudioside A concentration (mg∙mL-1) | |
|---|---|---|---|---|---|
| Initial condition | 60 | 65 | 30 | 2.59±0.04 | 1.06±0.08 |
| Optimal condition | 60 | 80 | 90 | 3.48±0.36* | 1.42±0.18* |
Table 8 Extraction concentration of stevioside and rebaudioside A by different extraction conditions
| Temperature (°C) | Power (J∙s-1) | Time (min) | Stevioside concentration (mg∙mL-1) | Rebaudioside A concentration (mg∙mL-1) | |
|---|---|---|---|---|---|
| Initial condition | 60 | 65 | 30 | 2.59±0.04 | 1.06±0.08 |
| Optimal condition | 60 | 80 | 90 | 3.48±0.36* | 1.42±0.18* |
| [1] | 陈育如, 杨凤平, 杨帆, 宋婷婷, 束成杰, 尹慧慧 (2016). 甜叶菊及甜菊糖的多效功能与保健应用. 南京师大学报(自然科学版) 39(2), 56-60. |
| [2] | 郎青云, 李慧, 祝谢民, 周艳, 史保国 (2019). 超声辅助纤维素酶提取甜菊糖及其抑菌活性研究. 安徽农学通报 25(21), 30-35. |
| [3] | 刘贵君, 石浩 (2016). 甜菊糖的应用研究进展. 浙江化工 47 (11), 34-41. |
| [4] | 吴则东, 张文彬, 吴玉梅, 刘乃新 (2016). 世界甜叶菊发展概况. 中国糖料 38(4), 62-65. |
| [5] | 严贤春 (2003). 天然甜味剂植物的开发利用研究. 食品研究与开发 24, 59-62. |
| [6] | 应以坚, 王雪奇 (2012). 生物产品甜菊苷综述. 轻工科技 28, 9-10, 53. |
| [7] |
张桂春, 刘玉静, 李延敏, 牟萍, 曲明娟, 李清, 周菊华 (2017). 火龙果果皮中可溶性膳食纤维的提取方法. 植物学报 52, 622-630.
DOI |
| [8] | 张杨, 陈天红, 孙君坦, 何炳林 (1998). 甜叶菊糖的组分分离与味质改进研究进展. 化学通报 (6), 11-16. |
| [9] | 赵永良, 韩骁, 刘景彬, 谢印芝 (2010). 膜分离技术在甜菊糖甙提取分离中的应用研究. 化学与生物工程 27, 84-85. |
| [10] |
Dai YT, Rozema E, Verpoorte R, Choi YH (2016). Application of natural deep eutectic solvents to the extraction of anthocyanins from Catharanthus roseus with high extractability and stability replacing conventional organic solvents. J Chromatogr A 1434, 50-56.
DOI URL |
| [11] |
Dai YT, Witkamp GJ, Verpoorte R, Choi YH (2015). Tailoring properties of natural deep eutectic solvents with water to facilitate their applications. Food Chem 187, 14-19.
DOI URL |
| [12] |
Erkucuk A, Akgun IH, Yesil-Celiktas O (2009). Supercritical CO2 extraction of glycosides from Stevia rebaudiana leaves: identification and optimization. J Supercrit Fluids 51, 29-35.
DOI URL |
| [13] |
Gasmalla MAA, Yang RJ, Musa A, Hua X, Ye FY (2017). Influence of sonication process parameters to the state of liquid concentration of extracted rebaudioside A from stevia (Stevia rebaudiana Bertoni) leaves. Arab J Chem 10, 726-731.
DOI URL |
| [14] |
Huang Y, Feng F, Jiang J, Qiao Y, Wu T, Voglmeir J, Chen ZG (2017). Green and efficient extraction of rutin from Tartary buckwheat hull by using natural deep eutectic solvents. Food Chem 221, 1400-1405.
DOI PMID |
| [15] |
Jaitak V, Bandna BS, Kaul VK (2009). An efficient microwave-assisted extraction process of stevioside and rebaudioside-A from Stevia rebaudiana (Bertoni). Phytochem Anal 20, 240-245.
DOI URL |
| [16] |
Jentzer JB, Alignan M, Vaca-Garcia C, Rigal L, Vilarem G (2015). Response surface methodology to optimise accelerated solvent extraction of steviol glycosides from Stevia rebaudiana Bertoni leaves. Food Chem 166, 561-567.
DOI URL |
| [17] |
Lemus-Mondaca R, Vega-Gálvez A, Zura-Bravo L, Ah- Hen K (2012). Stevia rebaudiana Bertoni, source of a high-potency natural sweetener: a comprehensive review on the biochemical, nutritional and functional aspects. Food Chem 132, 1121-1132.
DOI PMID |
| [18] |
Puri M, Sharma D, Barrow CJ, Tiwary AK (2012). Optimisation of novel method for the extraction of steviosides from Stevia rebaudiana leaves. Food Chem 132, 1113-1120.
DOI URL |
| [1] | SHAO Han-JuanHU Yong-GangDING LiangSHEN Ming-ShanCHEN Mu-ZhuanZHANG Xiang-Hong. Analysis of the Content of Stevia Sweeteners by Capillary Zone Electrophoresis [J]. Chinese Bulletin of Botany, 2001, 18(01): 113-117. |
| Viewed | ||||||
|
Full text |
|
|||||
|
Abstract |
|
|||||
 Home
Home