
影响中国东北和日本粳稻食味品质差异的质构因素及其遗传基础解析
†共同第一作者
收稿日期: 2024-12-20
录用日期: 2025-03-18
网络出版日期: 2025-03-18
基金资助
国家自然科学基金(32372107)
Analysis of the Texture Factors and Genetic Basis Influencing the Differences in Eating Quality between Northeast China and Japanese Japonica Rice
†These authors contributed equally to this paper
Received date: 2024-12-20
Accepted date: 2025-03-18
Online published: 2025-03-18
崔娟 , 于晓玉 , 于跃娇 , 梁铖玮 , 孙健 , 陈温福 . 影响中国东北和日本粳稻食味品质差异的质构因素及其遗传基础解析[J]. 植物学报, 2025 , 60(4) : 533 -550 . DOI: 10.11983/CBB24196
INTRODUCTION Due to differences in breeding objectives, northeast japonica rice (Oryza sativa subsp. geng or japonica) is more advantageous than Japanese japonica rice in terms of yield level, whereas Japanese japonica rice is significantly better than Chinese japonica rice in terms of eating quality. Clarifying the genetic basis of the differences in eating quality between Chinese and Japanese japonica rice is highly valuable for the cultivation of high-yield and high-quality japonica rice.
RATIONALEA total of 274 Chinese and Japanese japonica rice varieties were used as research materials to quantify the eating quality of the rice and to analyze the genetic basis of the taste differences between Chinese and Japanese japonica rice by combining genome-wide association analysis with the downscaling of many parameters.
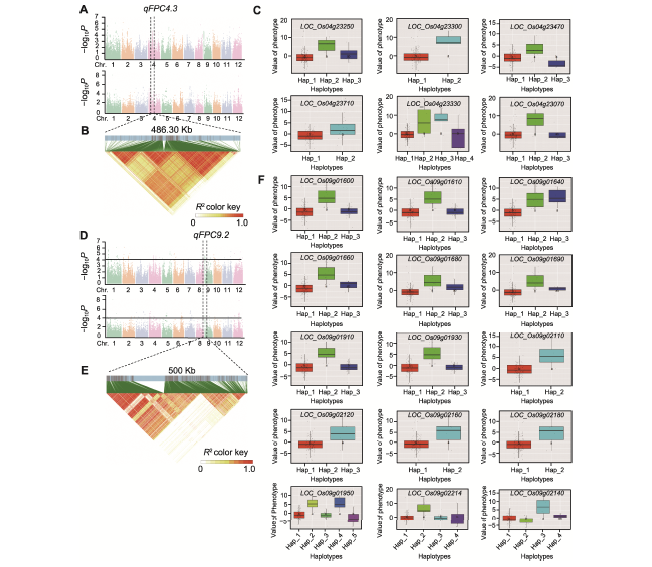
RESULTSThe results revealed that the significant differences in the taste values of Chinese and Japanese japonica rice were reflected in three textural parameters: the adhesion force (ADF), first recoverable deformation cycle (FRDC), and elasticity index (EI). Moreover, the correlation analysis between the taste values and 30 textural characters showed that 24 characters were significantly correlated with the taste value of rice. The 30 metrics of textural characterization were downscaled to four principal components that explained 80% of the phenotypic variation in the population, and the genome-wide associations of their eigenvalues were mined to two primary effector loci affecting the textural characterization of Chinese-Japanese japonica rice, qFPC4.3 and qFPC9.2.
CONCLUSION In this study, we quantified the parameters of eating quality from a qualitative perspective, and thus analyzed the genetic basis of the differences in eating quality between Chinese and Japanese rice, which provided valuable genetic information and a theoretical basis for the genetic improvement of the eating quality of japonica rice in China.
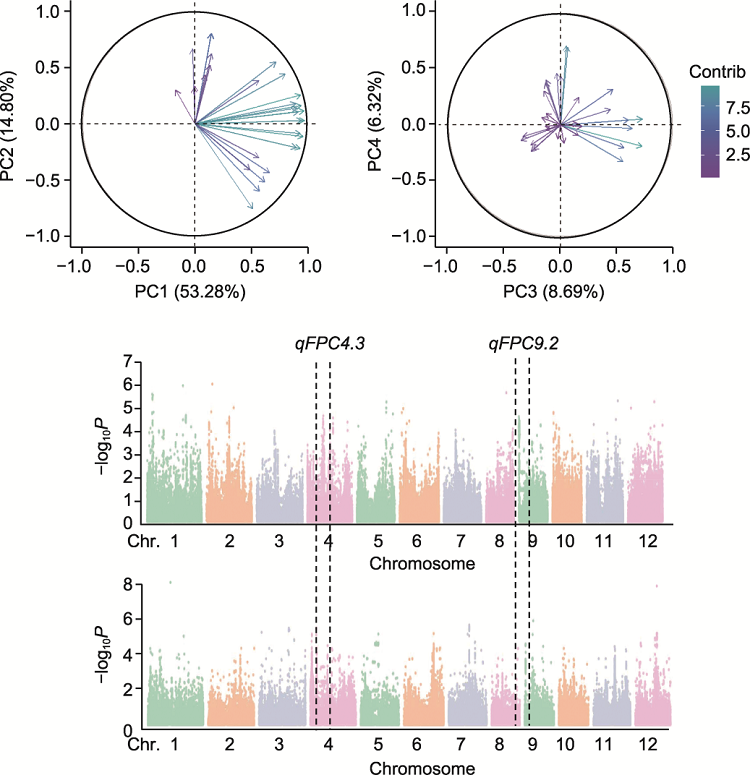
PCA analysis and genome-wide association studies based on principal component eigenvalues of texture characteristics indicators. PCA analysis was performed using 2021 data.
| [1] | Bian JL, Xu FF, Liu GD, Xu D, Zhu Y, Hu Q, Zhang HC, Wei HY (2023). Study on comprehensive evaluation method of Japonica rice eating quality in the middle and lower reaches of Yangtze River. J Yangzhou Univ Agric Life Sci Ed 44(5), 1-11. (in Chinese) |
| 卞金龙, 许方甫, 刘国栋, 徐栋, 朱盈, 胡群, 张洪程, 魏海燕 (2023). 长江中下游粳稻食味品质综合评价方法研究. 扬州大学学报(农业与生命科学版) 44(5), 1-11. | |
| [2] | Boomsma DI, Dolan CV (1998). A comparison of power to detect a QTL in sib-pair data using multivariate phenotypes, mean phenotypes, and factor scores. Behav Genet 28, 329-340. |
| [3] | Bu YP (2019). Identification of QTL for Vegetable Soybean Seed Hardness and Preliminary Functional Verification of Candidate Gene GmMFTL. PhD dissertation. Nanjing: Nanjing Agricultural University. pp. 53-68. (in Chinese) |
| 卜远鹏 (2019). 菜用大豆籽粒硬度QTL的定位及候选基因GmMFTL的初步功能验证. 博士论文. 南京: 南京农业大学. pp. 53-68. | |
| [4] | Cantor RM, Lange K, Sinsheimer JS (2010). Prioritizing GWAS results: a review of statistical methods and recommendations for their application. Am J Hum Genet 86, 6-22. |
| [5] | Chang JN, Jiao GA, Hui SZ, Guo W, Wang JL (2021). Research progress on influencing factors of rice texture properties. Mol Plant Breed 19, 2419-2426. (in Chinese) |
| 常俊楠, 焦桂爱, 惠索祯, 郭雯, 王建龙 (2021). 稻米质构特性影响因素的研究进展. 分子植物育种 19, 2419-2426. | |
| [6] | Chen HF, Hu SK, Tang SQ, Hu PS (2023). Current status and prospect of genetic improvement of rice grain quality. J Yangtze Univ (Nat Sci Ed) 20(5), 110-123. (in Chinese) |
| 陈宏法, 胡时开, 唐绍清, 胡培松 (2023). 稻米品质遗传改良现状及展望. 长江大学学报(自然科学版) 20(5), 110-123. | |
| [7] | Friendly M (2002). Corrgrams: exploratory displays for correlation matrices. Am Stat 56, 316-324. |
| [8] | Gao H, Jiang N, Lü GY, Xia YJ, Wang JY, Sun J, Tang L, Xu ZJ, Sui GM (2018). Dissection of grain yield differences between Japonica rice in Northeast China and in Japan. Chin J Rice Sci 32, 357-364. (in Chinese) |
| 高虹, 姜楠, 吕国依, 夏英俊, 王嘉宇, 孙健, 唐亮, 徐正进, 隋国民 (2018). 中国东北粳稻与日本粳稻产量差异及原因分析. 中国水稻科学 32, 357-364. | |
| [9] | Goh L, Yap VB (2009). Effects of normalization on quantitative traits in association test. BMC Bioinformatics 10, 415. |
| [10] | Gong JY, Miao JS, Zhao Y, Zhao Q, Feng Q, Zhan QL, Cheng BY, Xia JH, Huang XH, Yang SH, Han B (2017). Dissecting the genetic basis of grain shape and chalkiness traits in hybrid rice using multiple collaborative populations. Mol Plant 10, 1353-1356. |
| [11] | Guan B, Liu W, Liu CM, Su KM (2011). Effect of soaking treatment on pasting properties and textural properties of early indica rice. Food Mach 27(3), 13-15, 115. (in Chinese) |
| 官斌, 刘伟, 刘成梅, 苏坤明 (2011). 浸泡处理对早籼米糊化特性及质构特性的影响. 食品与机械 27(3), 13-15, 115. | |
| [12] | He LN, Liu YJ, Xiao P, Zhang L, Guo Y, Yang TL, Zhao LJ, Drees B, Hamilton J, Deng HY, Recker RR, Deng HW (2008). Genomewide linkage scan for combined obesity phenotypes using principal component analysis. Ann Hum Genet 72, 319-326. |
| [13] | Holberg CJ, Halonen M, Solomon S, Graves PE, Baldini M, Erickson RP, Martinez FD (2001). Factor analysis of asthma and atopy traits shows 2 major components, one of which is linked to markers on chromosome 5q. J Allergy Clin Immunol 108, 772-780. |
| [14] | Huang XH, Wei XH, Sang T, Zhao Q, Feng Q, Zhao Y, Li CY, Zhu CR, Lu TT, Zhang ZW, Li M, Fan DL, Guo YL, Wang AH, Wang L, Deng LW, Li WJ, Lu YQ, Weng QJ, Liu KY, Huang T, Zhou TY, Jing YF, Li W, Lin Z, Buckler ES, Qian Q, Zhang QF, Li JY, Han B (2010). Genome-wide association studies of 14 agronomic traits in rice landraces. Nat Genet 42, 961-967. |
| [15] | Isshiki M, Matsuda Y, Takasaki A, Wong HL, Satoh H, Shimamoto K (2008). Du3, a mRNA cap-binding protein gene, regulates amylose content in japonica rice seeds. Plant Biotechnol 25, 483-487. |
| [16] | Jiang JF (2020). Evaluation, QTL Analysis and Candidate Gene Prediction for Berry Texture in Vitis vinifera L. PhD dissertation. Yangling: Northwest A&F University. pp. 88-92. (in Chinese) |
| 姜建福 (2020). 葡萄果肉质地性状的评价、QTL定位及候选基因预测. 博士论文. 杨凌: 西北农林科技大学. pp. 88-92. | |
| [17] | Jin LC, Geng ZM, Li JZ, Wang P, Chen F, Liu AM (2011). Correlation between components and molecule structure of rice starch and eating quality. Jiangsu J Agric Sci 27, 13-18. (in Chinese) |
| 金丽晨, 耿志明, 李金州, 王澎, 陈菲, 刘蔼民 (2011). 稻米淀粉组成及分子结构与食味品质的关系. 江苏农业学报 27, 13-18. | |
| [18] | Li HY, Prakash S, Nicholson TM, Fitzgerald MA, Gilbert RG (2016). The importance of amylose and amylopectin fine structure for textural properties of cooked rice grains. Food Chem 196, 702-711. |
| [19] | Li XH, Zhang RY, Meng QH, Gao F, Yao XM, Xu CJ (2007). Advantages of palatability evaluation methods for japonica rice variety. North Rice (5), 5-9. (in Chinese) |
| 李霞辉, 张瑞英, 孟庆虹, 高锋, 姚鑫淼, 许长军 (2007). 粳稻品种食味品质评价方法的研究进展. 北方水稻 (5), 5-9. | |
| [20] | Li XM, Wang LF, Tang YS, Chang YJ, Zhang JX, Wang SM, Wu J (2023). Genome-wide association analysis of resistance to Acanthoscelides obtectus in common bean. Chin Bull Bot 58, 77-89. (in Chinese) |
| 李晓明, 王兰芬, 唐永生, 常玉洁, 张菊香, 王述民, 武晶 (2023). 普通菜豆抗菜豆象性状的全基因组关联分析. 植物学报 58, 77-89. | |
| [21] | Liao CY, Wu P, Hu B, Yi KK (2001). Effects of genetic background and environment on QTLs and epistasis for rice (Oryza sativa L.) panicle number. Theor Appl Genet 103, 104-111. |
| [22] | Lin T, Zhu GT, Zhang JH, Xu XY, Yu QH, Zheng Z, Zhang ZH, Lun YY, Li S, Wang XX, Huang ZJ, Li JM, Zhang CZ, Wang TT, Zhang YY, Wang AX, Zhang YC, Lin K, Li CY, Xiong GS, Xue YB, Mazzucato A, Causse M, Fei ZJ, Giovannoni JJ, Chetelat RT, Zamir D, St?dler T, Li JF, Ye ZB, Du YC, Huang SW (2014). Genomic analyses provide insights into the history of tomato breeding. Nat Genet 46, 1220-1226. |
| [23] | Lu H, Yuan YJ, Zhang SQ, Chen H, Chen D, Zhong XY, Li B, Deng F, Chen Y, Li GY, Ren WJ (2021). Evaluation of rice eating quality and optimization of varieties of southwest indica hybrid rice based on three taste evaluation methods. Sci Agric Sin 54, 1243-1257. (in Chinese) |
| 卢慧, 袁玉洁, 张丝琪, 陈虹, 陈多, 钟晓媛, 李博, 邓飞, 陈勇, 李贵勇, 任万军 (2021). 基于3种方法的西南杂交籼稻稻米食味评价及品种优选. 中国农业科学 54, 1243-1257. | |
| [24] | Meng QH, Meng CL, Yan S, Zhang ZH, Wang LQ, Zhang YL, Zhang SW, Lu SW (2017). Optimization of rice texture properties determination by three grains method. Food Sci Technol 42(5), 157-164. (in Chinese) |
| 孟庆虹, 孟春玲, 严松, 张志宏, 王丽群, 张英蕾, 张守文, 卢淑雯 (2017). 三粒法米饭质构测定参数优化. 食品科技 42(5), 157-164. | |
| [25] | Monna L, Lin H, Kojima S, Sasaki T, Yano M (2002). Genetic dissection of a genomic region for a quantitative trait locus, Hd3, into two loci, Hd3a and Hd3b, controlling heading date in rice. Theor Appl Genet 104, 772-778. |
| [26] | Shan ZC, Chen FZ (2023). Research progress on factors affecting the flavor quality of rice. Bull Agric Sci Technol (11), 140-143. (in Chinese) |
| 单智超, 陈富忠 (2023). 影响稻米食味品质因素的研究进展. 农业科技通讯 (11), 140-143. | |
| [27] | Shi SJ, Wang ET, Li CX, Cai ML, Cheng B, Cao CG, Jiang Y (2022). Use of protein content, amylose content, and RVA parameters to evaluate the taste quality of rice. Front Nutr 8, 758547. |
| [28] | Sreenivasulu N, Zhang CQ, Tiozon RN Jr, Liu QQ (2022). Post-genomics revolution in the design of premium quality rice in a high-yielding background to meet consumer demands in the 21st century. Plant Commun 3, 100271. |
| [29] | Sultana S, Faruque M, Islam R (2022). Rice grain quality parameters and determination tools: a review on the current developments and future prospects. Int J Food Prop 25, 1063-1078. |
| [30] | Sun L (2021). QTL Identification and Candidate Genes Analysis for Central Flesh Hardness of Watermelon (Citrullus lanatus). PhD dissertation. Harbin: Northeast Agricultural University. pp. 34-38. (in Chinese) |
| 孙蕾 (2021). 西瓜中心果肉硬度主效QTL及候选基因分析. 博士论文. 哈尔滨: 东北农业大学. pp. 34-38. | |
| [31] | Tang ZW, Zhang DP (2023). Research progress on the molecular mechanism of starch accumulation in rice endosperm. Chin Bull Bot 58, 612-621. (in Chinese) |
| 唐子雯, 张冬平 (2023). 水稻胚乳淀粉积累过程的分子机理研究进展. 植物学报 58, 612-621. | |
| [32] | Tu B, Zhang T, Liu P, Yang W, Zheng L, Dai Y, Wang H, Lin S, Zhang ZH, Zheng XH, Yuan MT, Chen Y, Zhu XB, Yuan H, Li T, Xiong JW, Zhong ZH, Chen WL, Ma BT, Qin P, Wang YP, Li SG (2025). The LCG1-OsBP5/ OsEBP89-Wx module regulates the grain chalkiness and taste quality in rice. Plant Biotechnol J 23, 36-50. |
| [33] | Wang CG, Ju RH, Ma CL, Liu XF, Duan LL (2015). Different cooking methods affect the quality of instant rice. Food Ind 36(2), 118-121. (in Chinese) |
| 汪长钢, 句荣辉, 马长路, 刘小飞, 段丽丽 (2015). 不同蒸煮方式对方便米饭品质影响研究. 食品工业 36(2), 118-121. | |
| [34] | Wang CL, Chang JN, Zhong KZ, Guo W, Hui SZ, Wang JL, Jiao GA (2022). QTL mapping of the traits for rice texture characteristics. Mol Plant Breed. http://kns.cnki.net/kcms/detail/46.1068.S.20220216.1055.002.html. (inChinese) |
| 王翠丽, 常俊楠, 钟开珍, 郭雯, 惠索祯, 王建龙, 焦桂爱 (2022). 米饭质构特性QTL定位分析. 分子植物育种. http://kns.cnki.net/kcms/detail/46.1068.S.20220216.1055.002.html. | |
| [35] | Wang LH, Zhang JN, Zhang XX, Sun HF, Zhou HL, Zhou S (2023). Research progress of rice taste quality and its influencing factors in China. Acta Agric Shanghai 39(3), 148-154. (in Chinese) |
| 王乐惠, 张继宁, 张鲜鲜, 孙会峰, 周化岚, 周胜 (2023). 我国稻米食味品质的研究进展及其影响因素. 上海农业学报 39(3), 148-154. | |
| [36] | Wang PY, Lu XH, Pang LJ (2016). Key physicochemical factors of rice affecting textural properties and sensory of cooked rice. Sci Technol Food Ind 37, 119-124. (in Chinese) |
| 王鹏跃, 路兴花, 庞林江 (2016). 影响米饭质构特性和感官的关键理化因素分析. 食品工业科技 37, 119-124. | |
| [37] | Wu BB, Hao YQ, Yang SB, Huang YX, Guan PF, Zheng XW, Zhao JJ, Qiao L, Li XH, Liu WZ, Zheng J (2023). Evaluation and genetic variation of grain lutein contents in common wheat from Shanxi. Chin Bull Bot 58, 535-547. (in Chinese) |
| 武棒棒, 郝宇琼, 杨淑斌, 黄雨茜, 关攀锋, 郑兴卫, 赵佳佳, 乔玲, 李晓华, 刘维仲, 郑军 (2023). 山西小麦籽粒叶黄素含量变异及遗传特性分析. 植物学报 58, 535-547. | |
| [38] | Wu CM, Sun CQ, Wang XK, Li ZC, Fu XL, Zhang Q (2003). Study on QTLs of grain eating quality characters in rice. J Jilin Agric Sci 28(2), 6-14. (in Chinese) |
| 吴长明, 孙传清, 王象坤, 李自超, 付秀林, 张强 (2003). 稻米食味品质性状的QTL分析. 吉林农业科学 28(2), 6-14. | |
| [39] | Xi M, Ji YL, Wu WG, Xu YZ, Sun XY, Zhou YJ (2020). Research progress and prospects of factors affecting rice eating quality. Chin Agric Sci Bull 36(12), 159-164. (in Chinese) |
| 习敏, 季雅岚, 吴文革, 许有尊, 孙雪原, 周永进 (2020). 水稻食味品质形成影响因素研究与展望. 中国农学通报 36(12), 159-164. | |
| [40] | Xu H, Li XK, Lu JH, Jiang K, Ma Y, Xu ZJ, Xu Q (2023). The effect of Indica/xian pedigree introgression in Japonica/geng rice breeding in China. Sci Agric Sin 56, 4359-4370. (in Chinese) |
| 徐海, 李秀坤, 芦佳浩, 姜恺, 马玥, 徐正进, 徐铨 (2023). 籼型血缘渗入对北方粳稻产量和品质的影响. 中国农业科学 56, 4359-4370. | |
| [41] | Xu Q, Tang L, Xu F, Fukushima A, Huang RD, Chen WF, Xu ZJ (2017). Research advances and prospects of eating quality improvement in Japonica rice (Oryza sativa L.). Acta Agron Sin 39, 961-968. (in Chinese) |
| 徐铨, 唐亮, 徐凡, 福嶌阳, 黄瑞冬, 陈温福, 徐正进 (2017). 粳稻食味品质改良研究现状与展望. 作物学报 39, 961-968. | |
| [42] | Xu R, Sui Y, Li SY, Zhu ZZ, Zhou L, Shi JB, Cai S, Xiong T, Cai F, Mei X (2024). Research progress on influencing factors of rice eating quality. J Food Saf Qual 15(7), 234-241. (in Chinese) |
| 许锐, 隋勇, 李书艺, 祝振洲, 周雷, 施建斌, 蔡沙, 熊添, 蔡芳, 梅新 (2024). 稻米食味品质影响因素研究进展. 食品安全质量检测学报 15(7), 234-241. | |
| [43] | Xu SN, Li CP (2011). Dissection to three typical issues of principal component analysis. Math Theor Appl 31(4), 116-121. (in Chinese) |
| 许淑娜, 李长坡 (2011). 对主成分分析法三个问题的剖析. 数学理论与应用 31(4), 116-121. | |
| [44] | Xu ZJ, Chen WF, Ma DR, Wu XD, Zheng YY, Wang JY (2005). Relationship between eating quality and other quality characters of rice in Liaoning. Acta Agron Sin 31, 1092-1094. (in Chinese) |
| 徐正进, 陈温福, 马殿荣, 吴晓冬, 郑煜焱, 王嘉宇 (2005). 辽宁水稻食味值及其与品质性状的关系. 作物学报 31, 1092-1094. | |
| [45] | Xu ZJ, Han Y, Shao GJ, Zhang XJ, Quan CZ, Pan GJ, Yan P, Chen WF (2010). Comparison of rice quality characters in Northeast region of China. Chin J Rice Sci 24, 531-534. (in Chinese) |
| 徐正进, 韩勇, 邵国军, 张学军, 全成哲, 潘国君, 闫平, 陈温福 (2010). 东北三省水稻品质性状比较研究. 中国水稻科学 24, 531-534. | |
| [46] | Yang TT, Wei J, Zou JX, Wu LM, Bao XZ, Huang Q, Chen QC, Zhang B (2023). Difference in grain qualities of early and late season dual-use rice cultivars planted in early and late seasons. J Nucl Agric Sci 37, 1843-1851. (in Chinese) |
| 杨陶陶, 韦佳, 邹积祥, 伍龙梅, 包晓哲, 黄庆, 陈青春, 张彬 (2023). 早晚兼用型水稻稻米品质在早、晚季的差异特征. 核农学报 37, 1843-1851. | |
| [47] | Yang XH, Nong BX, Xia XZ, Zhang ZQ, Zeng Y, Liu KQ, Deng GF, Li DT (2016). Genome-wide association study of genes related to waxiness in Oryza sativa. Chin Bull Bot 51, 737-742. (in Chinese) |
| 杨行海, 农保选, 夏秀忠, 张宗琼, 曾宇, 刘开强, 邓国富, 李丹婷 (2016). 水稻糯性相关基因的全基因组关联分析. 植物学报 51, 737-742. | |
| [48] | Yano K, Morinaka Y, Wang FM, Huang P, Takehara S, Hirai T, Ito A, Koketsu E, Kawamura M, Kotake K, Yoshida S, Endo M, Tamiya G, Kitano H, Ueguchi- Tanaka M, Hirano K, Matsuoka M (2019). GWAS with principal component analysis identifies a gene comprehensively controlling rice architecture. Proc Natl Acad Sci USA 116, 21262-21267. |
| [49] | Yao XY, Wang JY, Liu J, Wang Q, Jiang X, Jiang SK, Xu ZJ (2016). Dissection of quantitative trait loci for cooking and eating quality traits in Oryza sativa subsp. japonica. Chin Bull Bot 51, 757-763. (in Chinese) |
| 姚晓云, 王嘉宇, 刘进, 王棋, 姜鑫, 姜树坤, 徐正进 (2016). 粳稻蒸煮食味品质相关性状的QTL分析. 植物学报 51, 757-763. | |
| [50] | Yu ZR (2007). Mapping Quantitative Trait Loci Underlying the Texture and Cooking Quality of Rice Using A RIL Population. Master’s thesis. Wuhan: Huazhong Agricultural University. pp. 2-3. (in Chinese) |
| 余峥嵘 (2007). 米饭蒸煮品质以及质构的QTL定位研究. 硕士论文. 武汉: 华中农业大学. pp. 2-3. | |
| [51] | Zhang X, Safdar LB, Tang MQ, Liu YY, Zhang YY, Liu SY (2021). Genetic dissection of plant architecture-related traits by GWAS with PCA in Brassica napus. Chin J Oil Crop Sci 43, 462-469. (in Chinese) |
| 张旭, Safdar LB, 唐敏强, 刘越英, 张园园, 刘胜毅 (2021). 结合PCA和GWAS解析甘蓝型油菜株型相关性状的遗传调控位点. 中国油料作物学报 43, 462-469. | |
| [52] | Zhao KY, Tung CW, Eizenga GC, Wright MH, Ali ML, Price AH, Norton GJ, Islam MR, Reynolds A, Mezey J, McClung AM, Bustamante CD, McCouch SR (2011). Genome-wide association mapping reveals a rich genetic architecture of complex traits in Oryza sativa. Nat Commun 2, 467. |
| [53] | Zhou XL, Wang H, Zhou YM, Zhang H, Hu YQ (2017). Influence of different cooking methods on eating quality of rice. Food Sci 38(11), 75-80. (in Chinese) |
| 周小理, 王惠, 周一鸣, 张欢, 胡业芹 (2017). 不同烹煮方式对米饭食味品质的影响. 食品科学 38(11), 75-80. | |
| [54] | Zhou XQ, Ren HL, Zhang YR, Wang JF (2012). Correlation between texture property of cooked rice and main quality properties of rice. J Henan Univ Technol (Nat Sci Ed) 33(5), 21-24. (in Chinese) |
| 周显青, 任洪玲, 张玉荣, 王军锋 (2012). 大米主要品质指标与米饭质构的相关性分析. 河南工业大学学报(自然科学版) 33(5), 21-24. | |
| [55] | Zhu DW, Zhang LP, Chen MX, Fang CY, Yu YH, Zheng XL, Shao YF (2022). Characteristics of high-quality rice varieties and taste sensory evaluation values in China. Sci Agric Sin 55, 1271-1283. (in Chinese) |
| 朱大伟, 章林平, 陈铭学, 方长云, 于永红, 郑小龙, 邵雅芳 (2022). 中国优质稻品种品质及食味感官评分值的特征. 中国农业科学 55, 1271-1283. |
/
| 〈 |
|
〉 |

 首页
首页