
植物学报 ›› 2018, Vol. 53 ›› Issue (5): 671-685.DOI: 10.11983/CBB17083 cstr: 32102.14.CBB17083
刘强1,2,*( ), 蔡二丽1, 张嘉琳1, 宋翘1, 李秀红1,2, 窦宝成1,2
收稿日期:2017-04-14
接受日期:2017-08-30
出版日期:2018-09-01
发布日期:2018-11-29
通讯作者:
刘强
作者简介:† 共同第一作者。
基金资助:
Liu Qiang1,2,*(), Cai Erli1, Zhang Jialin1, Song Qiao1, Li Xiuhong1,2, Dou Baocheng1,2
Received:2017-04-14
Accepted:2017-08-30
Online:2018-09-01
Published:2018-11-29
Contact:
Liu Qiang
About author:† These authors contributed equally to this paper
摘要: 叶面积指数(LAI)的田间测量是生态和农业等领域的常规工作之一, 测量方法分为直接测量和间接测量, 间接测量中有一类方法基于数字相机照片提取冠层孔隙率, 再用有限长度平均法同时估算LAI和聚集指数。然而, 有限长度平均法自提出以来缺少进一步的发展, 在有限长度的样线/样方上应用比尔定律的方式具有理论缺陷, 可能造成无效值或高估LAI。从模拟的训练数据中提取经验公式以取代比尔定律进行样线/样方的LAI估算, 提高了有限长度平均法的精度和鲁棒性。进一步分析在一定精度需求下对样线/样方大小和数量的要求, 对于非均匀样地, 提出样线长度为8倍等效叶片边长、样方边长为3倍等效叶片边长的推荐设置。在基于数字相机照片提取非均匀样地LAI的应用中, 使用样方采样比样线采样更为适宜。
刘强, 蔡二丽, 张嘉琳, 宋翘, 李秀红, 窦宝成. 叶面积指数田间测量中有限长度平均法的改进. 植物学报, 2018, 53(5): 671-685.
Liu Qiang, Cai Erli, Zhang Jialin, Song Qiao, Li Xiuhong, Dou Baocheng. A Modification of the Finite-length Averaging Method in Measuring Leaf Area Index in Field. Chinese Bulletin of Botany, 2018, 53(5): 671-685.
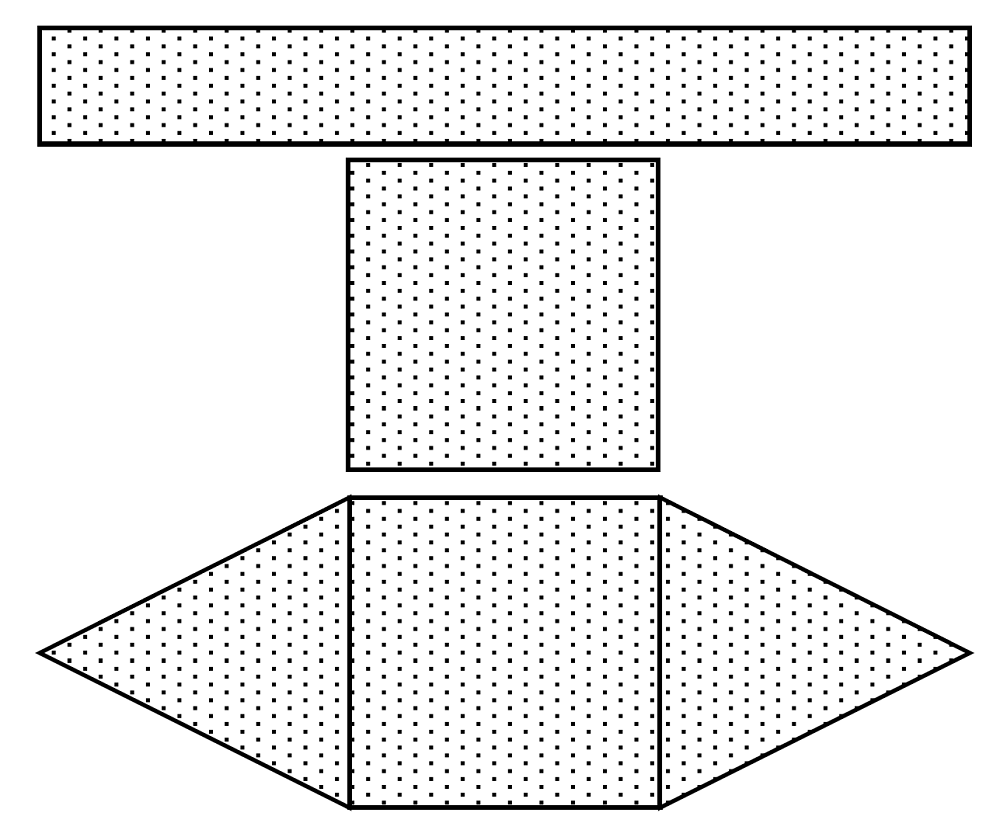
图1 模拟的3种叶形(条形、方形和梭形)
Figure 1 The 3 kinds of leaf shapes used in the simulation (strip, square and fusiform)
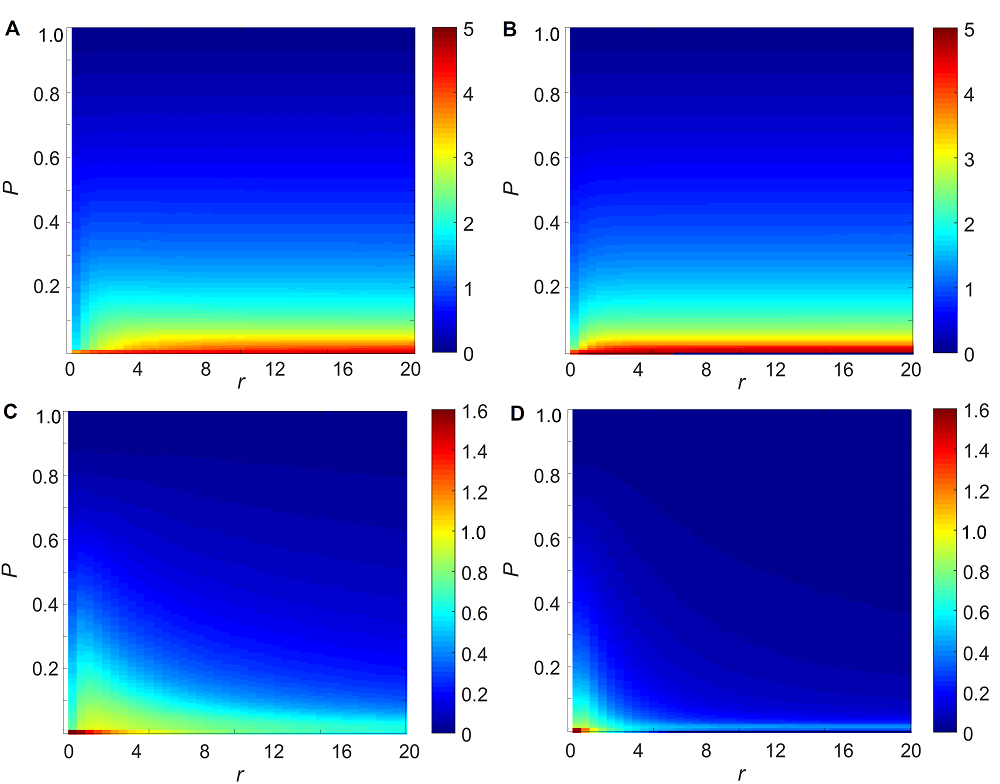
图2 在不同长度(r)条件下的叶面积指数投影均值($\overline{PLA}$)和标准差随冠层孔隙率(P)的变化(梭形叶片)(A) 样线采样的均值; (B) 样方采样的均值; (C) 样线采样的标准差; (D) 样方采样的标准差
Figure 2 The mean and standard deviation (stdev) of projected leaf area ($\overline{PLA}$) with respect to different length (r) and canopy porosity (P) (fusiform leaves)(A) Mean of sample lines; (B) Mean of sample squares; (C) Stdev of sample lines; (D) Stdev of sample squares
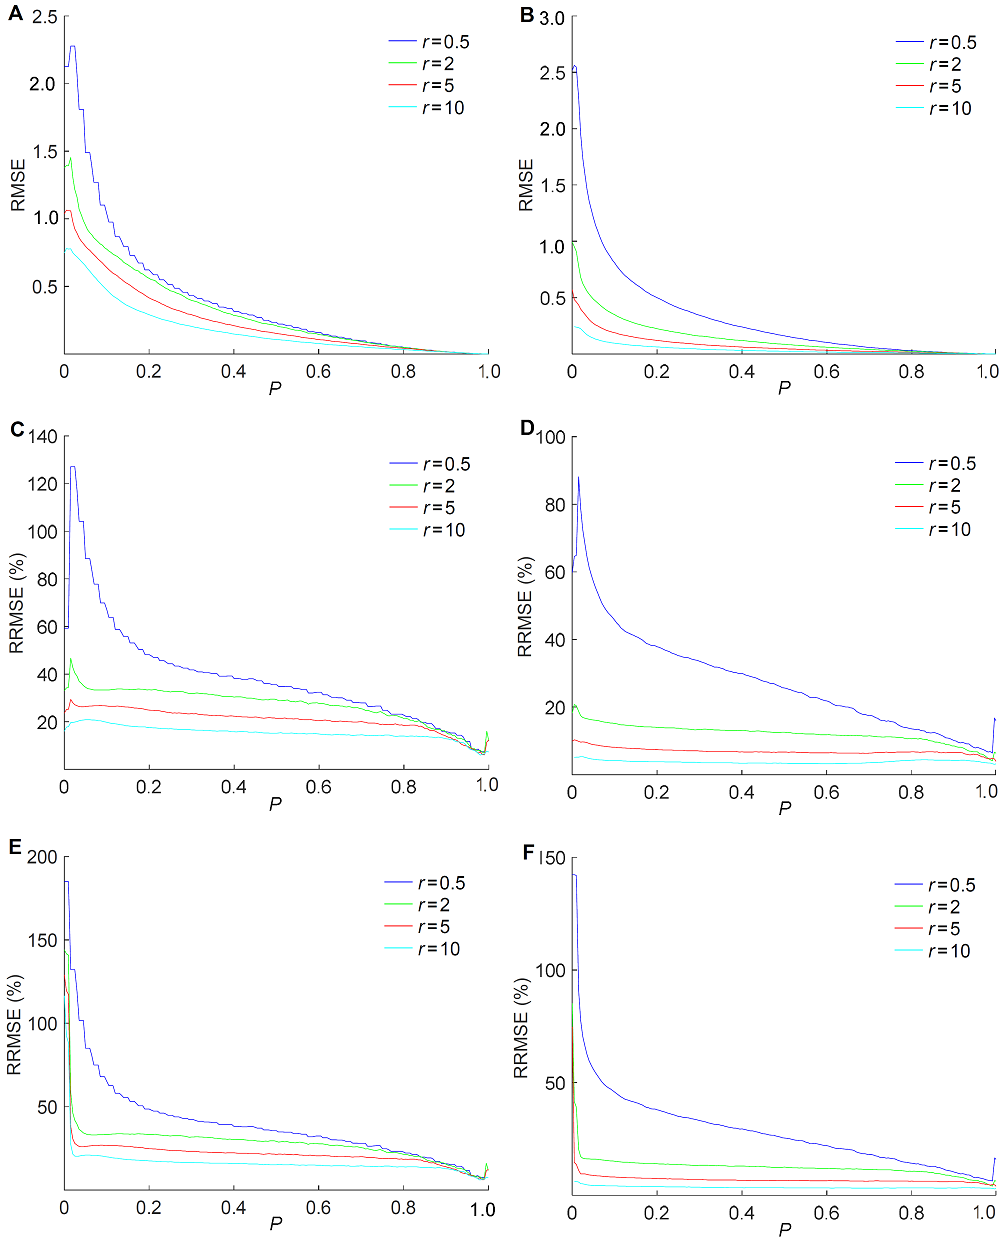
图3 梭形叶片在样线/样方尺度上估算叶面积指数投影(PLA)的误差(A) 样线采样方式使用ƒ*的均方根误差RMSE; (B) 样方采样方式使用ƒ*的均方根误差RMSE; (C) 样线采样方式使用ƒ*的相对误差RRMSE; (D) 样方采样方式使用ƒ*的相对误差RRMSE; (E) 样线采样方式使用比尔定律的相对误差RRMSE; (F) 样方采样方式使用比尔定律的相对误差RRMSE
Figure 3 The root mean square error (RMSE) and relative root mean square error (RRMSE) of the estimated projected leaf area (PLA) on the scale of sample line and sample square, simulated with fusiform leaf(A) RMSE using ƒ* in sample line; (B) RMSE using ƒ* in sample square; (C) RRMSE using ƒ* in sample line; (D) RRMSE using ƒ* in sample square; (E) RRMSE using Beer’s law in sample line; (F) RRMSE using Beer’s law in sample square
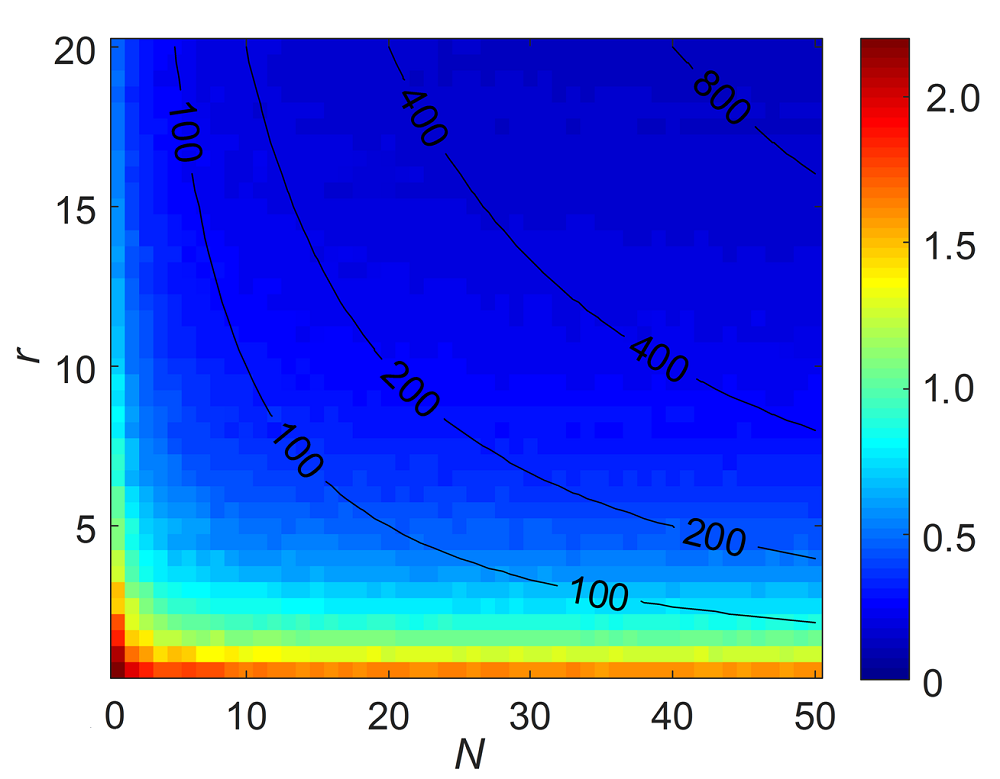
图4 样线长度(r)与样线数量(n)对应的样方叶面积指数投影均值($\overline{PLA}$)估算误差RMSE黑线为n∙r等值线($\overline{PLA}$约等于2, 样线采样方式, 叶片为梭形叶片, 样地内叶片为均匀随机分布)。
Figure 4 The RMSE of the estimated scene average projected leaf area ($\overline{PLA}$) with respect to sample line length r and sample number nThe black lines are contour lines of n∙r (Leaves are in fusiform shape and uniformly distributed in the scene, and the value of $\overline{PLA}$ is about 2).
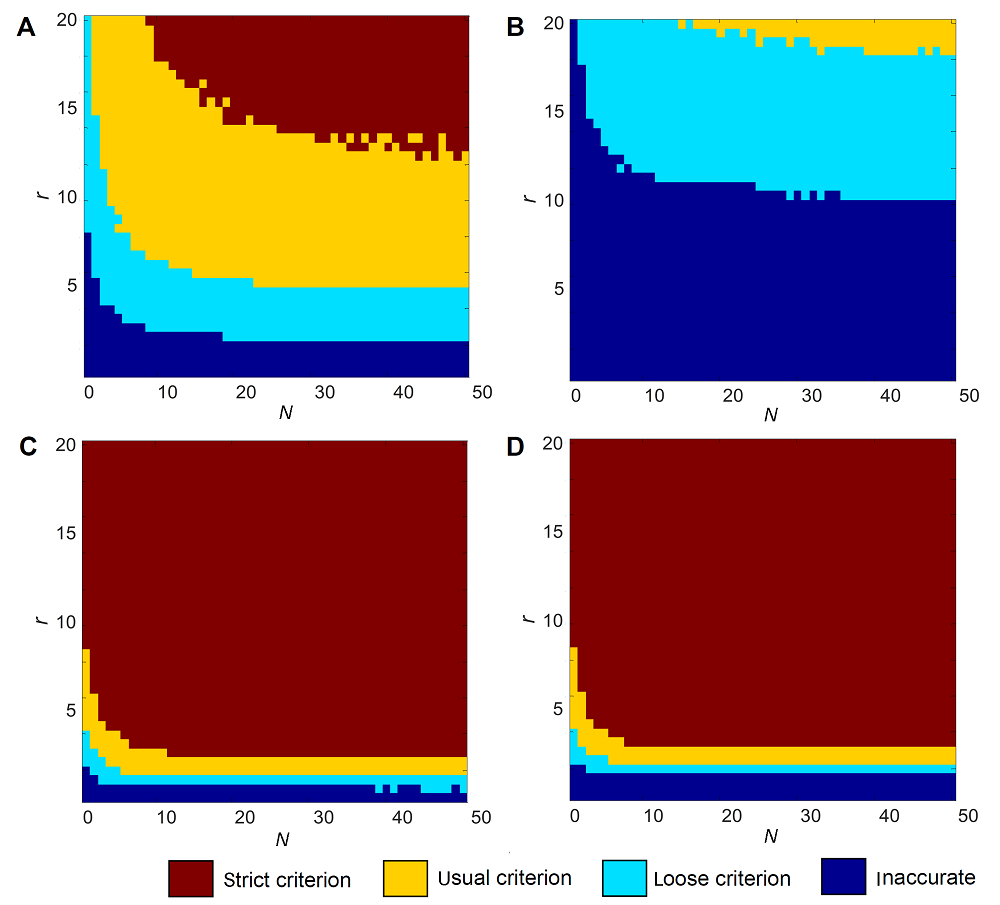
图5 测量均匀样地时严格、普通或宽松精度要求下的长度(r)和数量(n)的取值范围(梭形叶片)(A) 样线采样+ƒ*; (B) 样线采样+比尔定律; (C) 样方采样+ƒ*; (D) 样方采样+比尔定律
Figure 5 The required range of r and n in measuring LAI with different accuracy criterion, in homogeneous scene (fusiform leaves)(A) Sample line+ƒ*; (B) Sample line+Beer’s law; (C) Sample square+f *; (D) Sample square+Beer’s law
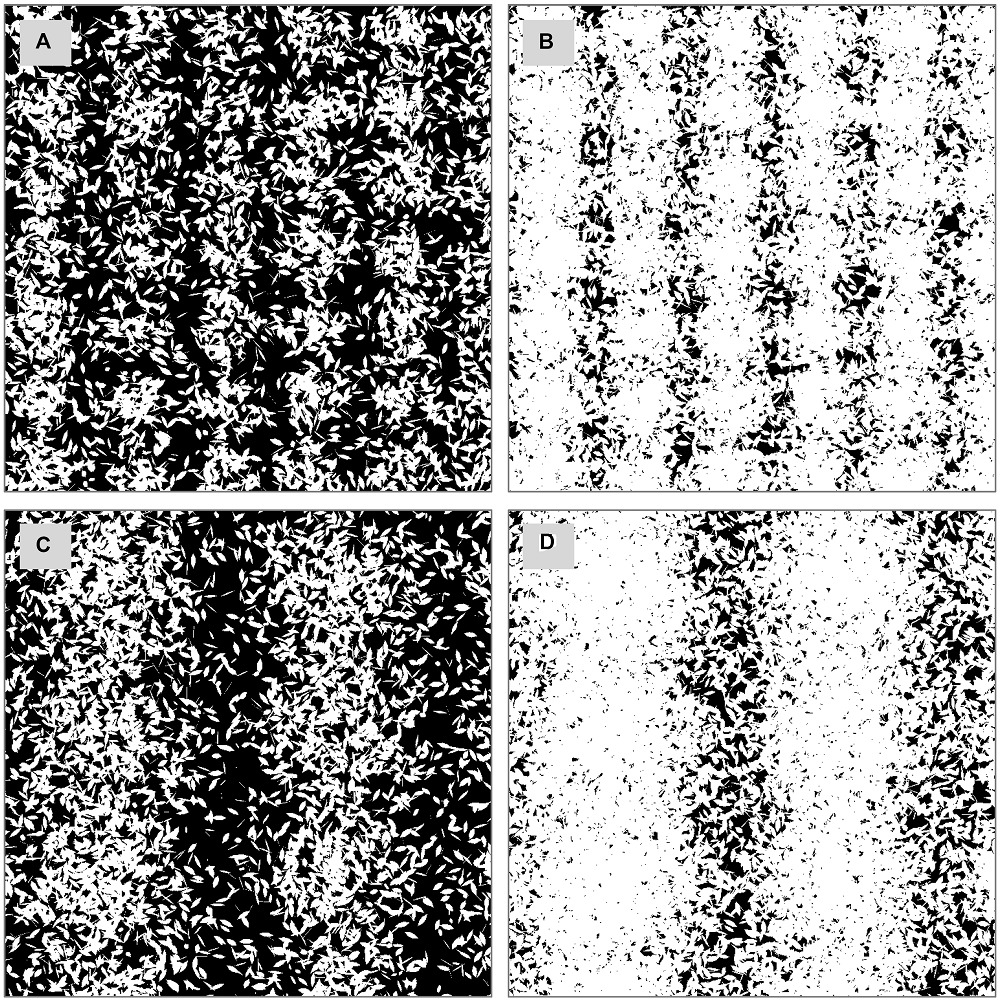
图6 模拟的叶片非均匀分布的场景A和场景B局部的孔隙情况(A) 场景A平均叶面积指数(LAI)约为1; (B) 场景A平均LAI约为4; (C) 场景B平均LAI约为1; (D) 场景B平均LAI约为4
Figure 6 The local gap image of the simulated scene A and scene B(A) Scene A with leaf area index (LAI) around 1; (B) Scene A with LAI around 4; (C) Scene B with LAI around 1; (D) Scene B with LAI around 4
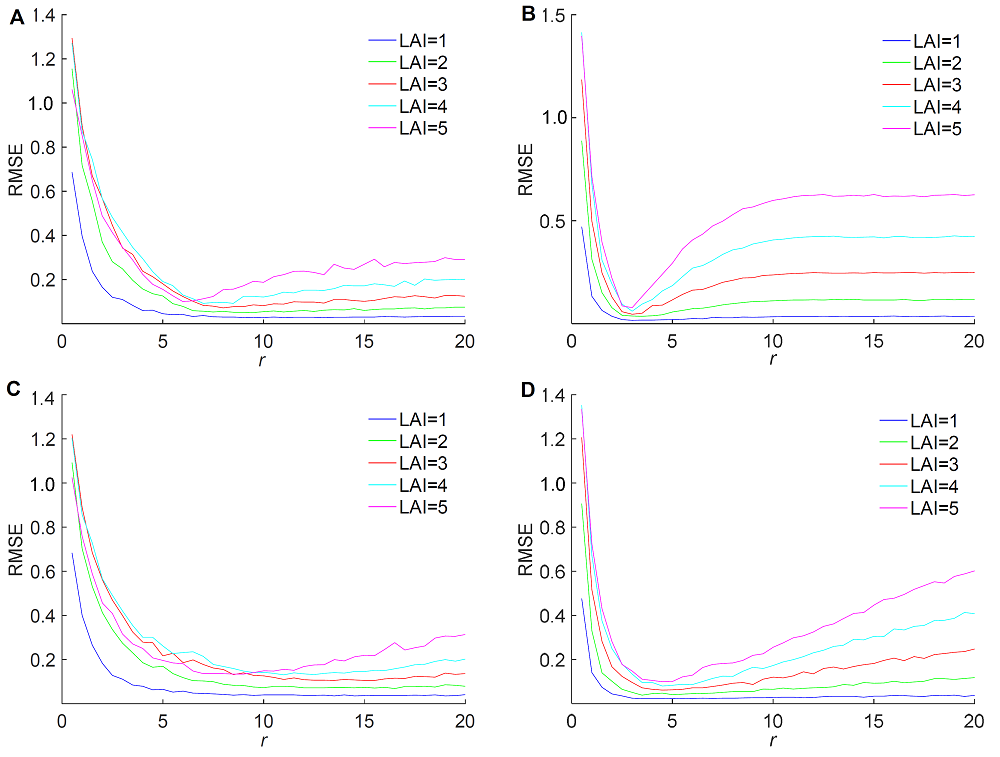
图7 对于模拟的非均匀场景选取不同的长度(r)估算叶面积指数投影(PLA)的RMSE(A) 场景A样线采样; (B) 场景A样方采样; (C) 场景B样线采样; (D) 场景B样方采样
Figure 7 The RMSE of estimated projected leaf area (PLA) in heterogeneous scene with respect to different length (r)(A) Scene A with sample line; (B) Scene A with sample square; (C) Scene B with sample line; (D) Scene B with sample square
| Scene ID | True values | Beer’s law | ƒ* of fusiform leaves | ƒ* of square leaves | ƒ* of strip leaves | |||||||||||||
|---|---|---|---|---|---|---|---|---|---|---|---|---|---|---|---|---|---|---|
| LAI | CI | LAI | RMSE | CI | LAI | RMSE | CI | LAI | RMSE | CI | LAI | RMSE | CI | |||||
| A | 1.03 | 0.94 | 1.05 | 0.06 | 0.91 | 1.05 | 0.06 | 0.91 | 1.05 | 0.06 | 0.92 | 1.05 | 0.06 | 0.92 | ||||
| A | 2.06 | 0.88 | 2.11 | 0.12 | 0.87 | 2.10 | 0.11 | 0.87 | 2.11 | 0.12 | 0.87 | 2.10 | 0.11 | 0.87 | ||||
| A | 3.07 | 0.84 | 3.13 | 0.18 | 0.82 | 3.08 | 0.15 | 0.84 | 3.09 | 0.15 | 0.83 | 3.08 | 0.15 | 0.84 | ||||
| A | 4.10 | 0.79 | 4.25 | 0.30 | 0.76 | 4.03 | 0.20 | 0.80 | 4.05 | 0.19 | 0.80 | 4.03 | 0.20 | 0.81 | ||||
| A | 5.14 | 0.76 | 5.66 | 0.64 | 0.69 | 4.92 | 0.30 | 0.79 | 4.93 | 0.30 | 0.79 | 4.93 | 0.30 | 0.79 | ||||
| B | 1.03 | 0.92 | 1.09 | 0.09 | 0.88 | 1.09 | 0.09 | 0.88 | 1.08 | 0.09 | 0.88 | 1.08 | 0.09 | 0.88 | ||||
| B | 2.06 | 0.85 | 2.17 | 0.17 | 0.80 | 2.16 | 0.17 | 0.80 | 2.18 | 0.18 | 0.80 | 2.16 | 0.17 | 0.80 | ||||
| B | 3.08 | 0.79 | 3.46 | 0.46 | 0.71 | 3.30 | 0.30 | 0.74 | 3.32 | 0.32 | 0.74 | 3.30 | 0.30 | 0.74 | ||||
| B | 4.11 | 0.74 | 5.03 | 1.00 | 0.62 | 4.37 | 0.35 | 0.71 | 4.37 | 0.36 | 0.70 | 4.38 | 0.36 | 0.70 | ||||
| B | 5.12 | 0.70 | 6.66 | 1.63 | 0.54 | 5.18 | 0.27 | 0.69 | 5.17 | 0.26 | 0.69 | 5.22 | 0.29 | 0.68 | ||||
表1 样线采样方式下使用不同公式估算的叶面积指数(LAI)和聚集指数(CI)
Table 1 Estimated LAI and CI with sample line and different formulas
| Scene ID | True values | Beer’s law | ƒ* of fusiform leaves | ƒ* of square leaves | ƒ* of strip leaves | |||||||||||||
|---|---|---|---|---|---|---|---|---|---|---|---|---|---|---|---|---|---|---|
| LAI | CI | LAI | RMSE | CI | LAI | RMSE | CI | LAI | RMSE | CI | LAI | RMSE | CI | |||||
| A | 1.03 | 0.94 | 1.05 | 0.06 | 0.91 | 1.05 | 0.06 | 0.91 | 1.05 | 0.06 | 0.92 | 1.05 | 0.06 | 0.92 | ||||
| A | 2.06 | 0.88 | 2.11 | 0.12 | 0.87 | 2.10 | 0.11 | 0.87 | 2.11 | 0.12 | 0.87 | 2.10 | 0.11 | 0.87 | ||||
| A | 3.07 | 0.84 | 3.13 | 0.18 | 0.82 | 3.08 | 0.15 | 0.84 | 3.09 | 0.15 | 0.83 | 3.08 | 0.15 | 0.84 | ||||
| A | 4.10 | 0.79 | 4.25 | 0.30 | 0.76 | 4.03 | 0.20 | 0.80 | 4.05 | 0.19 | 0.80 | 4.03 | 0.20 | 0.81 | ||||
| A | 5.14 | 0.76 | 5.66 | 0.64 | 0.69 | 4.92 | 0.30 | 0.79 | 4.93 | 0.30 | 0.79 | 4.93 | 0.30 | 0.79 | ||||
| B | 1.03 | 0.92 | 1.09 | 0.09 | 0.88 | 1.09 | 0.09 | 0.88 | 1.08 | 0.09 | 0.88 | 1.08 | 0.09 | 0.88 | ||||
| B | 2.06 | 0.85 | 2.17 | 0.17 | 0.80 | 2.16 | 0.17 | 0.80 | 2.18 | 0.18 | 0.80 | 2.16 | 0.17 | 0.80 | ||||
| B | 3.08 | 0.79 | 3.46 | 0.46 | 0.71 | 3.30 | 0.30 | 0.74 | 3.32 | 0.32 | 0.74 | 3.30 | 0.30 | 0.74 | ||||
| B | 4.11 | 0.74 | 5.03 | 1.00 | 0.62 | 4.37 | 0.35 | 0.71 | 4.37 | 0.36 | 0.70 | 4.38 | 0.36 | 0.70 | ||||
| B | 5.12 | 0.70 | 6.66 | 1.63 | 0.54 | 5.18 | 0.27 | 0.69 | 5.17 | 0.26 | 0.69 | 5.22 | 0.29 | 0.68 | ||||
| Scene ID | True values | Beer’s law | ƒ* of fusiform leaves | ƒ* of square leaves | ƒ* of strip leaves | |||||||||||||
|---|---|---|---|---|---|---|---|---|---|---|---|---|---|---|---|---|---|---|
| LAI | CI | LAI | RMSE | CI | LAI | RMSE | CI | LAI | RMSE | CI | LAI | RMSE | CI | |||||
| A | 1.03 | 0.94 | 1.04 | 0.04 | 0.92 | 1.03 | 0.03 | 0.93 | 1.03 | 0.03 | 0.93 | 1.04 | 0.03 | 0.92 | ||||
| A | 2.06 | 0.88 | 2.11 | 0.08 | 0.87 | 2.10 | 0.07 | 0.87 | 2.10 | 0.07 | 0.87 | 2.10 | 0.08 | 0.87 | ||||
| A | 3.08 | 0.83 | 3.10 | 0.09 | 0.83 | 3.08 | 0.09 | 0.83 | 3.08 | 0.09 | 0.83 | 3.08 | 0.09 | 0.83 | ||||
| A | 4.11 | 0.79 | 4.15 | 0.13 | 0.79 | 4.12 | 0.12 | 0.80 | 4.12 | 0.12 | 0.80 | 4.13 | 0.12 | 0.80 | ||||
| A | 5.14 | 0.76 | 5.20 | 0.18 | 0.76 | 5.09 | 0.15 | 0.77 | 5.08 | 0.16 | 0.77 | 5.12 | 0.14 | 0.77 | ||||
| B | 1.03 | 0.92 | 1.06 | 0.05 | 0.89 | 1.05 | 0.05 | 0.90 | 1.05 | 0.05 | 0.90 | 1.06 | 0.05 | 0.89 | ||||
| B | 2.06 | 0.85 | 2.13 | 0.10 | 0.82 | 2.11 | 0.09 | 0.83 | 2.12 | 0.09 | 0.83 | 2.12 | 0.10 | 0.82 | ||||
| B | 3.08 | 0.79 | 3.23 | 0.18 | 0.76 | 3.21 | 0.17 | 0.77 | 3.21 | 0.17 | 0.77 | 3.23 | 0.18 | 0.77 | ||||
| B | 4.11 | 0.74 | 4.34 | 0.27 | 0.71 | 4.30 | 0.24 | 0.71 | 4.30 | 0.24 | 0.72 | 4.31 | 0.24 | 0.71 | ||||
| B | 5.14 | 0.70 | 5.49 | 0.40 | 0.65 | 5.34 | 0.27 | 0.67 | 5.33 | 0.25 | 0.67 | 5.37 | 0.29 | 0.67 | ||||
表2 样方采样方式下使用不同公式估算的叶面积指数(LAI)和聚集指数(CI)
Table 2 Estimated leaf area index (LAI) and clumping index (CI) with sample square and different formulas
| Scene ID | True values | Beer’s law | ƒ* of fusiform leaves | ƒ* of square leaves | ƒ* of strip leaves | |||||||||||||
|---|---|---|---|---|---|---|---|---|---|---|---|---|---|---|---|---|---|---|
| LAI | CI | LAI | RMSE | CI | LAI | RMSE | CI | LAI | RMSE | CI | LAI | RMSE | CI | |||||
| A | 1.03 | 0.94 | 1.04 | 0.04 | 0.92 | 1.03 | 0.03 | 0.93 | 1.03 | 0.03 | 0.93 | 1.04 | 0.03 | 0.92 | ||||
| A | 2.06 | 0.88 | 2.11 | 0.08 | 0.87 | 2.10 | 0.07 | 0.87 | 2.10 | 0.07 | 0.87 | 2.10 | 0.08 | 0.87 | ||||
| A | 3.08 | 0.83 | 3.10 | 0.09 | 0.83 | 3.08 | 0.09 | 0.83 | 3.08 | 0.09 | 0.83 | 3.08 | 0.09 | 0.83 | ||||
| A | 4.11 | 0.79 | 4.15 | 0.13 | 0.79 | 4.12 | 0.12 | 0.80 | 4.12 | 0.12 | 0.80 | 4.13 | 0.12 | 0.80 | ||||
| A | 5.14 | 0.76 | 5.20 | 0.18 | 0.76 | 5.09 | 0.15 | 0.77 | 5.08 | 0.16 | 0.77 | 5.12 | 0.14 | 0.77 | ||||
| B | 1.03 | 0.92 | 1.06 | 0.05 | 0.89 | 1.05 | 0.05 | 0.90 | 1.05 | 0.05 | 0.90 | 1.06 | 0.05 | 0.89 | ||||
| B | 2.06 | 0.85 | 2.13 | 0.10 | 0.82 | 2.11 | 0.09 | 0.83 | 2.12 | 0.09 | 0.83 | 2.12 | 0.10 | 0.82 | ||||
| B | 3.08 | 0.79 | 3.23 | 0.18 | 0.76 | 3.21 | 0.17 | 0.77 | 3.21 | 0.17 | 0.77 | 3.23 | 0.18 | 0.77 | ||||
| B | 4.11 | 0.74 | 4.34 | 0.27 | 0.71 | 4.30 | 0.24 | 0.71 | 4.30 | 0.24 | 0.72 | 4.31 | 0.24 | 0.71 | ||||
| B | 5.14 | 0.70 | 5.49 | 0.40 | 0.65 | 5.34 | 0.27 | 0.67 | 5.33 | 0.25 | 0.67 | 5.37 | 0.29 | 0.67 | ||||
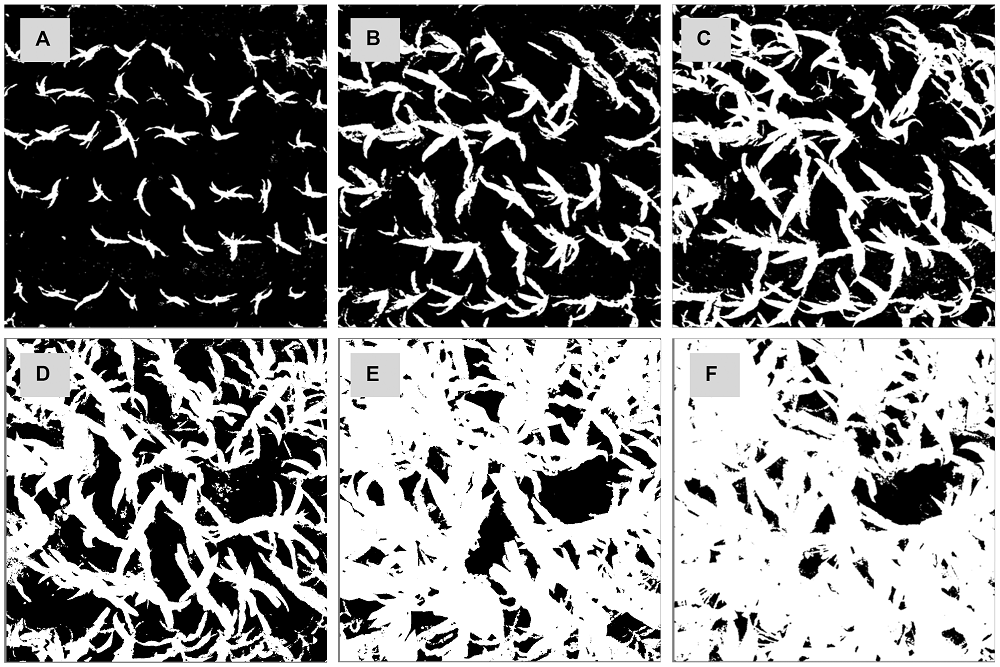
图8 河北怀来遥感综合试验站内玉米样地观测点自动拍照相片提取的叶片掩膜图时间序列(A) 5月30日; (B) 6月7日; (C) 6月13日; (D) 6月20日; (E) 7月4日; (F) 7月16日
Figure 8 The time series of extracted leaf-cover from the digital photos acquired by the wireless LAI-Sensor in the corn field in Huailai Remote Sensing Test Station of Hebei province(A) May 30th; (B) June 7th; (C) June 13th; (D) June 20th; (E) July 4th; (F) July 16th
| Observation date | Measured LAI | Average single leaf area (cm2) | Leaf age | Average plants density | Equivalent leaf side length (cm) | Estimated LAI | |||
|---|---|---|---|---|---|---|---|---|---|
| Setting A | Setting B | Setting C | Setting D | ||||||
| May 30th | 0.1359 | 40.74 | 6 | 5.56 | 4.0368 | 0.1885 | 0.1916 | 0.1929 | 0.1963 |
| June 7th | 0.5507 | 133.93 | 8 | 5.14 | 7.3193 | 0.5149 | 0.5206 | 0.5041 | 0.5124 |
| June 13th | 0.8898 | 173.12 | 10 | 5.14 | 8.3215 | 0.9626 | 0.9669 | 0.9377 | 0.9500 |
| June 20th | 1.3663 | 300.96 | 10 | 4.54 | 10.972 | 1.4123 | 1.4170 | 1.3702 | 1.3858 |
| June 27th | - | - | - | - | 12.323 | 2.5817 | 2.6493 | 2.4040 | 2.4331 |
| July 4th | 3.1837 | 467.50 | 15 | 4.54 | 13.675 | 3.4230 | 3.4990 | 3.1904 | 3.2443 |
| July 16th | 3.7523 | 550.99 | 15 | 4.54 | 14.846 | 4.6051 | 4.8787 | 4.1786 | 4.3009 |
表3 河北怀来遥感综合试验站内玉米样地田间测量参数以及从照片估算的叶面积指数(LAI)
Table 3 The measured corn canopy parameters and estimated leaf area index (LAI) from digital photo of the corn field in Huailai Remote Sensing Test Station of Hebei province
| Observation date | Measured LAI | Average single leaf area (cm2) | Leaf age | Average plants density | Equivalent leaf side length (cm) | Estimated LAI | |||
|---|---|---|---|---|---|---|---|---|---|
| Setting A | Setting B | Setting C | Setting D | ||||||
| May 30th | 0.1359 | 40.74 | 6 | 5.56 | 4.0368 | 0.1885 | 0.1916 | 0.1929 | 0.1963 |
| June 7th | 0.5507 | 133.93 | 8 | 5.14 | 7.3193 | 0.5149 | 0.5206 | 0.5041 | 0.5124 |
| June 13th | 0.8898 | 173.12 | 10 | 5.14 | 8.3215 | 0.9626 | 0.9669 | 0.9377 | 0.9500 |
| June 20th | 1.3663 | 300.96 | 10 | 4.54 | 10.972 | 1.4123 | 1.4170 | 1.3702 | 1.3858 |
| June 27th | - | - | - | - | 12.323 | 2.5817 | 2.6493 | 2.4040 | 2.4331 |
| July 4th | 3.1837 | 467.50 | 15 | 4.54 | 13.675 | 3.4230 | 3.4990 | 3.1904 | 3.2443 |
| July 16th | 3.7523 | 550.99 | 15 | 4.54 | 14.846 | 4.6051 | 4.8787 | 4.1786 | 4.3009 |
| 1 | 王锦地, 张戈, 肖月庭, 屈永华 (2007). 基于地物波谱库构造农作物生长参数的时空分布先验知识. 北京师范大学学报(自然科学版) 43, 284-291. |
| 2 | 吴朝阳, 牛铮 (2008). 基于辐射传输模型的高光谱植被指数与叶绿素浓度及叶面积指数的线性关系改进. 植物学通报 25, 714-721. |
| 3 | 杨贵军, 黄文江, 王纪华, 邢著荣 (2010). 多源多角度遥感数据反演森林叶面积指数方法. 植物学报 45, 566-578. |
| 4 | 姚延娟, 范闻捷, 刘强, 李丽, 陶欣, 辛晓洲, 柳钦火 (2010). 玉米全生长期叶面积指数收获测量法的改进. 农业工程学报26(8), 189-194. |
| 5 | Baret F, De Solan B, Lopez-Lozano R, Ma K, Weiss M (2010). GAI estimates of row crops from downward looking digital photos taken perpendicular to rows at 57.5° zenith angle: theoretical considerations based on 3D architecture models and application to wheat crops.Agric Forest Meteor 150, 1393-1401. |
| 6 | Chen JM, Cihlar J (1995). Plant canopy gap-size analysis theory for improving optical measurements of leaf-area index.Appl Opt 34, 6211-6222. |
| 7 | Guo QH, Wu FF, Pang SX, Zhao XQ, Chen LH, Liu J, Xue BL, Xu GC, Li L, Jing HC, Chu CC (2016). Crop 3D: a platform based on LiDAR for 3D high-throughput crop phenotyping.Sci Sin Vitae 46, 1210-1221. |
| 8 | Hu RH, Yan GJ, Mu XH, Luo JH (2014). Indirect measurement of leaf area index on the basis of path length distribution.Remote Sens Environ 155, 239-247. |
| 9 | Jonckheere I, Fleck S, Nackaerts K, Muys B, Coppin P, Weiss M, Baret F (2004). Review of methods for in situ leaf area index determination: Part I. Theories, sensors and hemispherical photography. Agric Forest Meteor 121, 19-35. |
| 10 | Lang ARG, Xiang YQ (1986). Estimation of leaf area index from transmission of direct sunlight in discontinuous cano- pies.Agric Forest Meteor 37, 229-243. |
| 11 | Leblanc SG, Chen JM, Fernandes R, Deering DW, Conley A (2005). Methodology comparison for canopy structure parameters extraction from digital hemispherical photography in boreal forests.Agric Forest Meteor 129, 187-207. |
| 12 | Li XH, Liu Q, Yang RJ, Zhang HJ, Zhang JL, Cai EL (2015). The design and implementation of the leaf area index sensor.Sensors 15, 6250-6269. |
| 13 | Liu JG, Pattey E (2010). Retrieval of leaf area index from top-of-canopy digital photography over agricultural crops.Agric Forest Meteor 150, 1485-1490. |
| 14 | Liu YK, Mu XH, Wang HX, Yan GJ (2012). A novel method for extracting green fractional vegetation cover from digital images.J Veg Sci 23, 406-418. |
| 15 | Myneni RB, Hoffman S, Knyazikhin Y, Privette JL, Glassy J, Tian Y, Wang Y, Song X, Zhang Y, Smith GR, Lotsch A, Friedl M, Morisette JT, Votava P, Nemani RR, Running SW (2002). Global products of vegetation leaf area and fraction absorbed PAR from year one of MODIS data.Remote Sens Environ 83, 214-231. |
| 16 | Piayda A, Dubbert M, Werner C, Correia AV, Pereira JS, Cuntz M (2015). Influence of woody tissue and leaf clum- ping on vertically resolved leaf area index and angular gap probability estimates.Forest Ecol Manage 340, 103-113. |
| 17 | Wang HX, Zhang WM, Zhou GQ, Yan GJ, Clinton N (2009). Image-based 3D corn reconstruction for retrieval of geometrical structural parameters.Int J Remote Sens 30, 5505-5513. |
| 18 | Weiss M, Baret F, Smith GJ, Jonckheere I, Coppin P (2004). Review of methods for in situ leaf area index (LAI) determination: Part II. Estimation of LAI, errors and samp- ling. Agric Forest Meteor 121, 37-53. |
| 19 | Woodgate W, Disney M, Armston JD, Jones SD, Suarez L, Hill MJ, Wilkes P, Soto-Berelov M, Haywood A, Mellor A (2015). An improved theoretical model of canopy gap probability for leaf area index estimation in woody ecosys- tems.Forest Ecol Manage 358, 303-320. |
| 20 | Xiao ZQ, Liang SL, Wang JD, Chen P, Yin XJ, Zhang LQ, Song JL (2014). Use of general regression neural networks for generating the glass leaf area index product from time-series MODIS surface reflectance.IEEE Trans Geosci Remote Sens 52, 209-223. |
| 21 | Xu XR, Fan WJ, Tao X (2009). The spatial scaling effect of continuous canopy leaves area index retrieved by remote sensing.Sci China Ser D: Earth Sci 52, 393-401. |
| [1] | 陈德付, 梁铭荣, 许益镌. 垂直空间层次蚂蚁采样方法概述[J]. 生物多样性, 2025, 33(8): 25078-. |
| [2] | 姚雪, 陈星, 戴尊, 宋坤, 邢诗晨, 曹宏彧, 邹璐, 王健. 采集策略对叶附生苔类植物发现概率及物种多样性的重要性[J]. 生物多样性, 2023, 31(4): 22685-. |
| [3] | 饶杰生, 杨涛, 田希, 刘文聪, 王晓凤, 钱恒君, 沈泽昊. 基于背包LiDAR的半湿润常绿阔叶林及其常见树种的垂直结构特征[J]. 生物多样性, 2023, 31(11): 23216-. |
| [4] | 郑周涛, 张扬建. 1982-2018年青藏高原水分利用效率变化及归因分析[J]. 植物生态学报, 2022, 46(12): 1486-1496. |
| [5] | 刘兵兵, 魏建新, 胡天宇, 杨秋丽, 刘小强, 吴发云, 苏艳军, 郭庆华. 卫星遥感监测产品在中国森林生态系统的验证和不确定性分析——基于海量无人机激光雷达数据[J]. 植物生态学报, 2022, 46(10): 1305-1316. |
| [6] | 刘超, 李平, 武运涛, 潘胜难, 贾舟, 刘玲莉. 一种基于数码相机图像和群落冠层结构调查的草地地上生物量估算方法[J]. 植物生态学报, 2022, 46(10): 1280-1288. |
| [7] | 戴尊, 陈星, 张建行, 朱毛洁, 宋坤, 邢诗晨, 涂淑雯, 邹璐, 雷祖培, 李宏庆, 王健. 浙江乌岩岭国家级自然保护区叶附生苔类及附主植物多样性[J]. 生物多样性, 2022, 30(1): 21229-. |
| [8] | 邢诗晨, 唐录艳, 戴尊, 涂淑雯, 陈星, 张建行, 李宏庆, 彭涛, 王健. 安徽石台县与青阳县苔藓植物多样性[J]. 生物多样性, 2022, 30(1): 21186-. |
| [9] | 黄松宇, 贾昕, 郑甲佳, 杨睿智, 牟钰, 袁和第. 中国典型陆地生态系统波文比特征及影响因素[J]. 植物生态学报, 2021, 45(2): 119-130. |
| [10] | 杨焕莹, 宋建达, 周焘, 金光泽, 姜峰, 刘志理. 林分、土壤及空间因子对谷地云冷杉林叶面积指数空间异质性的影响[J]. 植物生态学报, 2019, 43(4): 342-351. |
| [11] | 刘泽彬, 王彦辉, 刘宇, 田奥, 王亚蕊, 左海军. 宁夏六盘山半湿润区华北落叶松林冠层叶面积指数的时空变化及坡面尺度效应[J]. 植物生态学报, 2017, 41(7): 749-760. |
| [12] | 高林, 王晓菲, 顾行发, 田庆久, 焦俊男, 王培燕, 李丹. 植冠下土壤类型差异对遥感估算冬小麦叶面积指数的影响[J]. 植物生态学报, 2017, 41(12): 1273-1288. |
| [13] | 周明, 刘志理, 金光泽. 利用3种校正方案提高间接法测定兴安落叶松人工林叶面积指数的精度[J]. 植物生态学报, 2016, 40(6): 574-584. |
| [14] | 朱绪超, 袁国富, 邵明安, 易小波, 杜涛. 塔里木河下游河岸带植被的空间结构特征[J]. 植物生态学报, 2015, 39(11): 1053-1061. |
| [15] | 刘志理, 金光泽, 周明. 利用直接法和间接法测定针阔混交林叶面积指数的季节动态[J]. 植物生态学报, 2014, 38(8): 843-856. |
| 阅读次数 | ||||||
|
全文 |
|
|||||
|
摘要 |
|
|||||
 首页
首页