Chinese Bulletin of Botany
2016, 51 (
):
226-234.
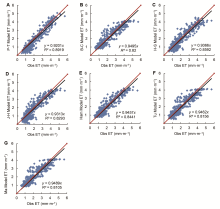
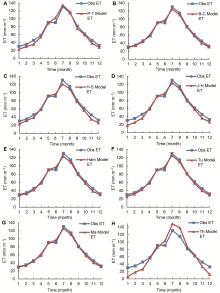
Using meteorological and evapotranspiration (ET) data acquired at the Eddy Covariance Flux tower in Qian- yanzhou, Jiangxi Province, for 2003 to 2007, we evaluated the applicability of 8 widely used evapotranspiration simulation models (Priestly-Taylor, Blaney-Criddle, Hargreaves-Samani, Jensen-Haise, Hamon, Turc, Makkink and Thornthwaite) for a forest ecosystem. Among these 8 models, the Priestly-Taylor model was the best (R=0.953) on a daily time scale, the Makkink model was the best (R=0.995) on a monthly scale, and the Thornthwaite model was the worst on a monthly scale (RMSE=15.559, MBE=13.436). The Jensen-Haise model failed in simulation of ET on both day and month scales. Partial correlation analysis of simulated ET against meteorological factors showed that the order of factors contributing to ET for the forest ecosystem was radiation>air temperature>surface pressure>wind speed>soil temperature>relative humidity>daytime length. Radiation was the most important driving factor for ET, which is consistent with the performance of radiation-based ET models (e.g., the Priestly-Taylor and Makkink models) being better than other models.

 Home
Home