)
)
)
)
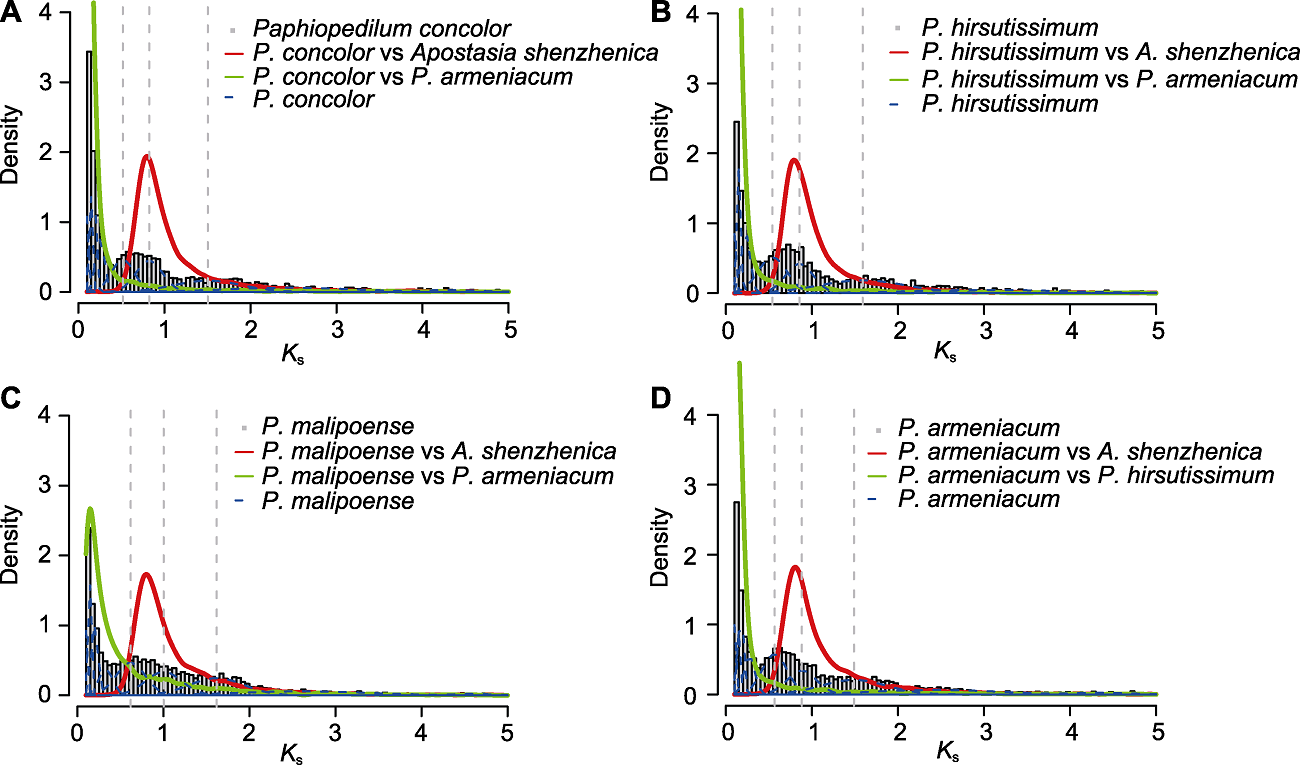
图2. 4种兜兰的Ks密度分布
灰色直方图: 物种内旁系同源基因的Ks密度分布; 红色曲线: 4种兜兰与深圳拟兰间直系同源基因的Ks密度分布; 绿色曲线: 杏黄兜兰与其它3种兜兰间直系同源基因的Ks密度分布; 蓝色虚线: 物种内旁系同源基因Ks值的高斯混合模型拟合结果; 灰色虚线: 高斯混合模型显著拟合到的Ks峰值。
Figure 2. The density plot of Ks from four species of Paphiopedilum
Histograms filled in grey: The density distributions of intraspecies paralogue Ks values; Red solid curves: The Ks density plots of interspecies orthologues between four species of Paphiopedilum and Apostasia shenzhenica; Green solid curves: The Ks density plots of interspecies orthologues between P. armeniacum and other three species of Paphiopedilum; Blue dashed curves: The fitting results based on Gaussian mixture modeling of intraspecies paralogue Ks values; Grey dashed lines: The Ks values of significant peaks identified by Gaussian mixture modeling.