)
)
)
)
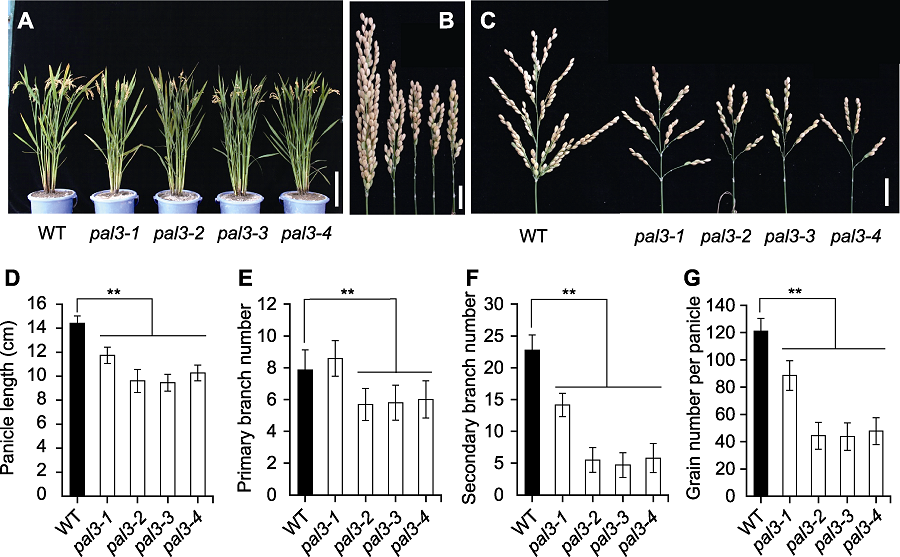
图1. 水稻野生型与pal3突变体的表型比较
(A) 野生型与pal3突变体的成熟期株型(Bar=20 cm); (B) 闭合状态下野生型与pal3突变体的穗(Bar=2 cm); (C) 展开状态下野生型与pal3突变体的穗(右) (Bar=2 cm); (D)-(G) 野生型与pal3突变体的穗长(D)、一级枝梗数(E)、二级枝梗数(F)和穗粒数(G)的统计分析。WT: 野生型。图中数据为平均值±标准差(n=20)。**表示在P<0.01水平差异显著(经t检验)。
Figure 1. Comparison of the rice phenotype between wild type and the pal3 mutants
(A) Gross morphology of wild type and the pal3 mutants at mature stage (Bar=20 cm); (B) Closed panicle of wild type and the pal3 mutants (Bar=2 cm); (C) Spread panicles of wild type and the pal3 mutants (right) (Bar=2 cm); (D)-(G) Statistic analysis of panicle length (D), primary branch number (E), secondary branch number (F) and grain number per panicle (G) of wild type and the pal3 mutants. WT: Wild type. Data in figure are means±SD (n=20). ** indicate the significant differences at P<0.01 level by Students’t test.