), 穆丹1,*()
), Dan Mu1,*()
), 穆丹1,*()
), Dan Mu1,*()
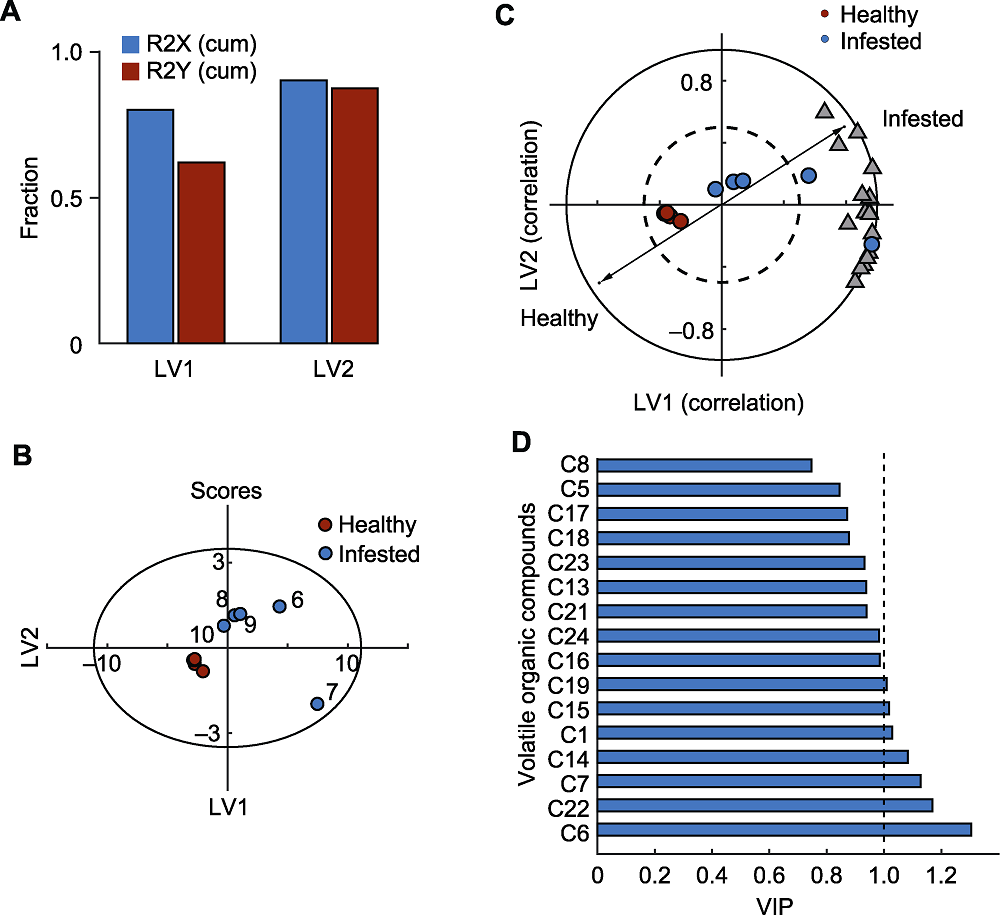
图5. 茶树挥发物组分的偏最小二乘法判别分析
(A) 前2个隐变量(LVs)累计解释总变异百分比(红色为自变量, 蓝色为因变量); (B) 健康组和蚜害组在前2个隐变量的得分图(椭圆为基于Hotelling T2计算出的95%置信域); (C) 偏最小二乘法判别分析双标图(实线圆半径为1.0, 虚线圆半径为0.5); (D) 各挥发物(编号同
Figure 5. The partial least square discriminant analysis for volatile contents of tea plants
(A) The fraction of cumulative explained variations for the first two latent variables (LVs) (red: predictor, blue: response); (B) Scores for the healthy and infested groups with respect to the LV1 and LV2 (the eclipse denotes the 95% confidence interval based on Hotelling T2); (C) The biplot in partial least squares discrimination analysis (the radius for solid and dashed circle is 1.0 and 0.5, respectively); (D) Variable importance for the projection (VIPs) for each volatile (the number is the same as