微区XRF技术分析无机元素在植物中的原位分布
林梵宇, 尹希杰*( ), 梁毓娜, 黄杰超
), 梁毓娜, 黄杰超
Analysis of In Situ Distribution of Inorganic Elements in Plants by Micro-XRF
Fanyu Lin, Xijie Yin*(), Yuna Liang, Jiechao Huang
), Yuna Liang, Jiechao Huang
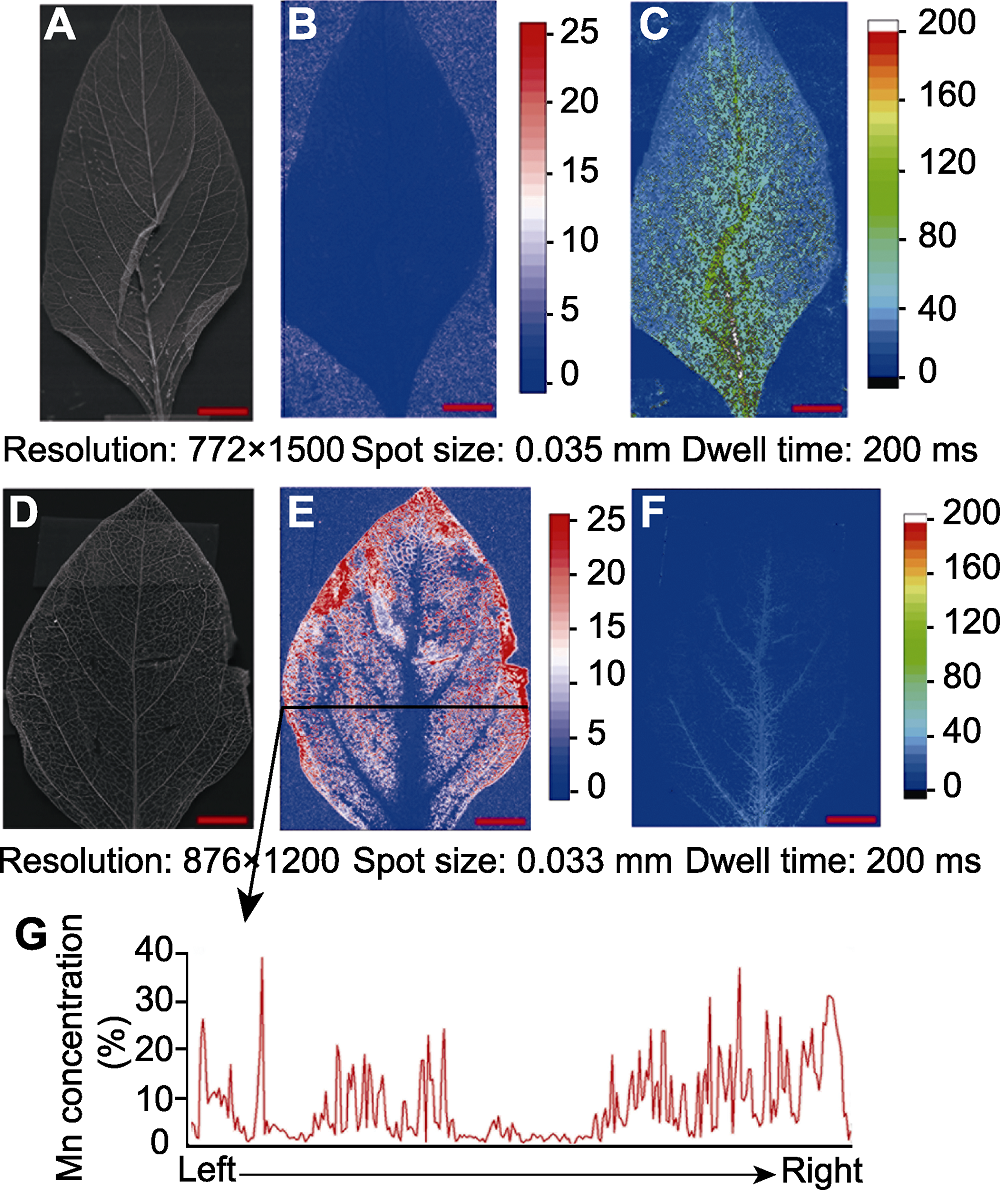
图3. 叶片样品中锰元素的分布
(A)-(C) 对照组 ((A) 叶片样品; (B) 锰元素浓度分布热图; (C)钙锰比值分布色图); (D)-(G) 实验组 ((D) 叶片样品; (E) 锰元素浓度分布热图; (F) 钙锰比值分布色图; (G) 锰元素线性分布情况)。Bars=5 mm
Figure 3. Distribution characteristics of Mn in leaf
(A)-(C) Control group ((A) Leaf; (B) Mn concentration heatmap; (C) Ca/Mn colormap); (D)-(G) Experimental group ((D) Leaf; (E) Mn concentration heatmap; (F) Ca/Mn colormap; (G) Linear distribution of Mn). Bars=5 mm