生物信息学分析方法I: 全基因组关联分析概述
赵宇慧1, 李秀秀1,2, 陈倬1,2, 鲁宏伟1,2, 刘羽诚1,2, 张志方1,2, 梁承志1,2,*( )
)
)
An Overview of Genome-wide Association Studies in Plants
Yuhui Zhao1, Xiuxiu Li1,2, Zhuo Chen1,2, Hongwei Lu1,2, Yucheng Liu1,2, Zhifang Zhang1,2, Chengzhi Liang1,2,*()
)
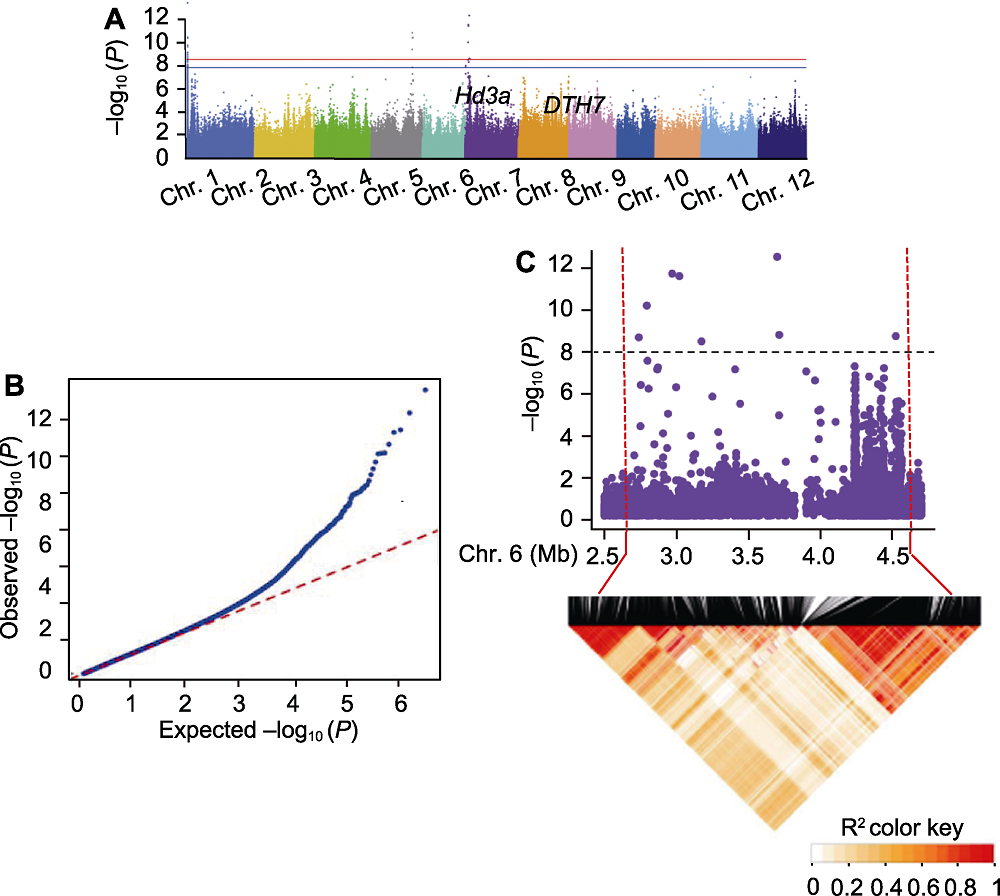
图4. 721份水稻材料抽穗期全基因组关联分析(GWAS)结果展示
(A) 抽穗期性状关联分析结果的曼哈顿图; (B) QQ图; (C) 局部曼哈顿图和6号染色体尖峰附近的LD热图。曼哈顿图中红色虚线标出候选区间, 黑色虚线表示显著性阈值-log10 (P)=7.80。
Figure 4. Genome-wide association study (GWAS) results of 721 rice accessions for heading date
(A) Manhattan plots of GWAS results for heading date; (B) QQ plot; (C) Local manhattan plots and LD heatmap around the peak on chromosome 6. Candidate region was labelled by red dotted line while the black dotted line indicated threshold -log10 (P)=7.80.