蔗糖对桃幼苗生长发育及其SnRK1酶活性的影响
张淑辉,王红,王文茹,吴雪莲,肖元松,彭福田( )
)
)
Effects of Sucrose on Seedling Growth and Development and SnRK1 Activity in Prunus persica
Shuhui Zhang,Hong Wang,Wenru Wang,Xuelian Wu,Yuansong Xiao,Futian Peng()
)
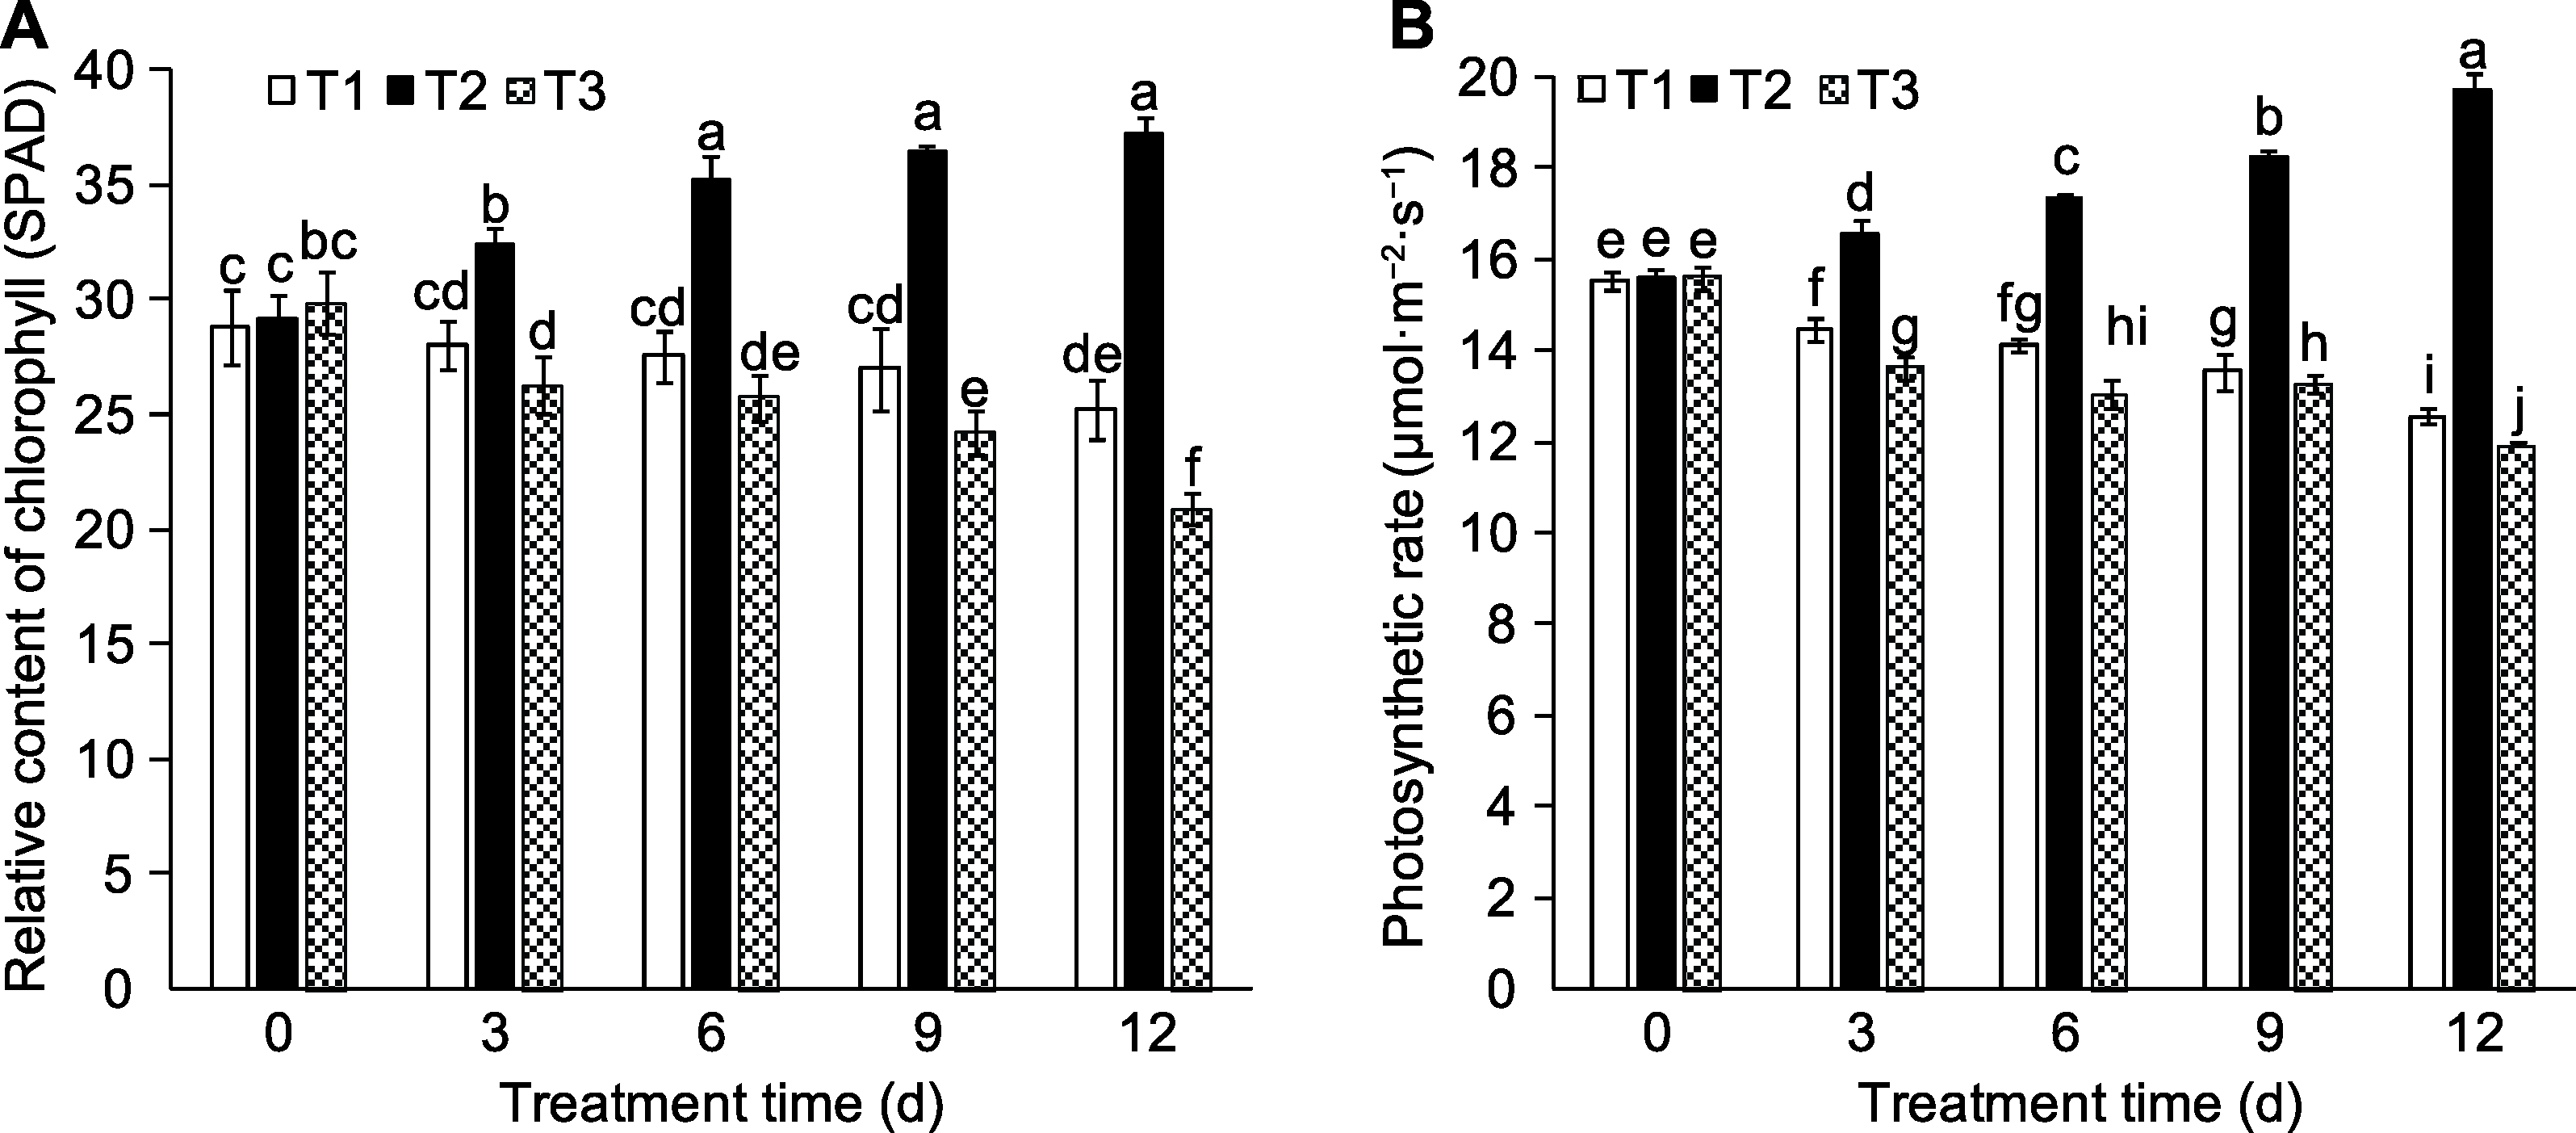
图5. 外源蔗糖对桃功能叶片叶绿素相对含量(A)和净光合速率(B)的影响
T1-T3同
Figure 5. Effects of exogenous sucrose on relative content of chlorophyll (A) and photosynthetic rate (B) of peach leaves
T1-T3 see Ffddigure 2. Different lowercase letters above the bars indicate significant differences among different treatments (P<0.05).