大豆蛋白编码基因起源与进化
唐康,杨若林( )
)
)
Origin and Evolution of Soybean Protein-coding Genes
Kang Tang,Ruolin Yang()
)
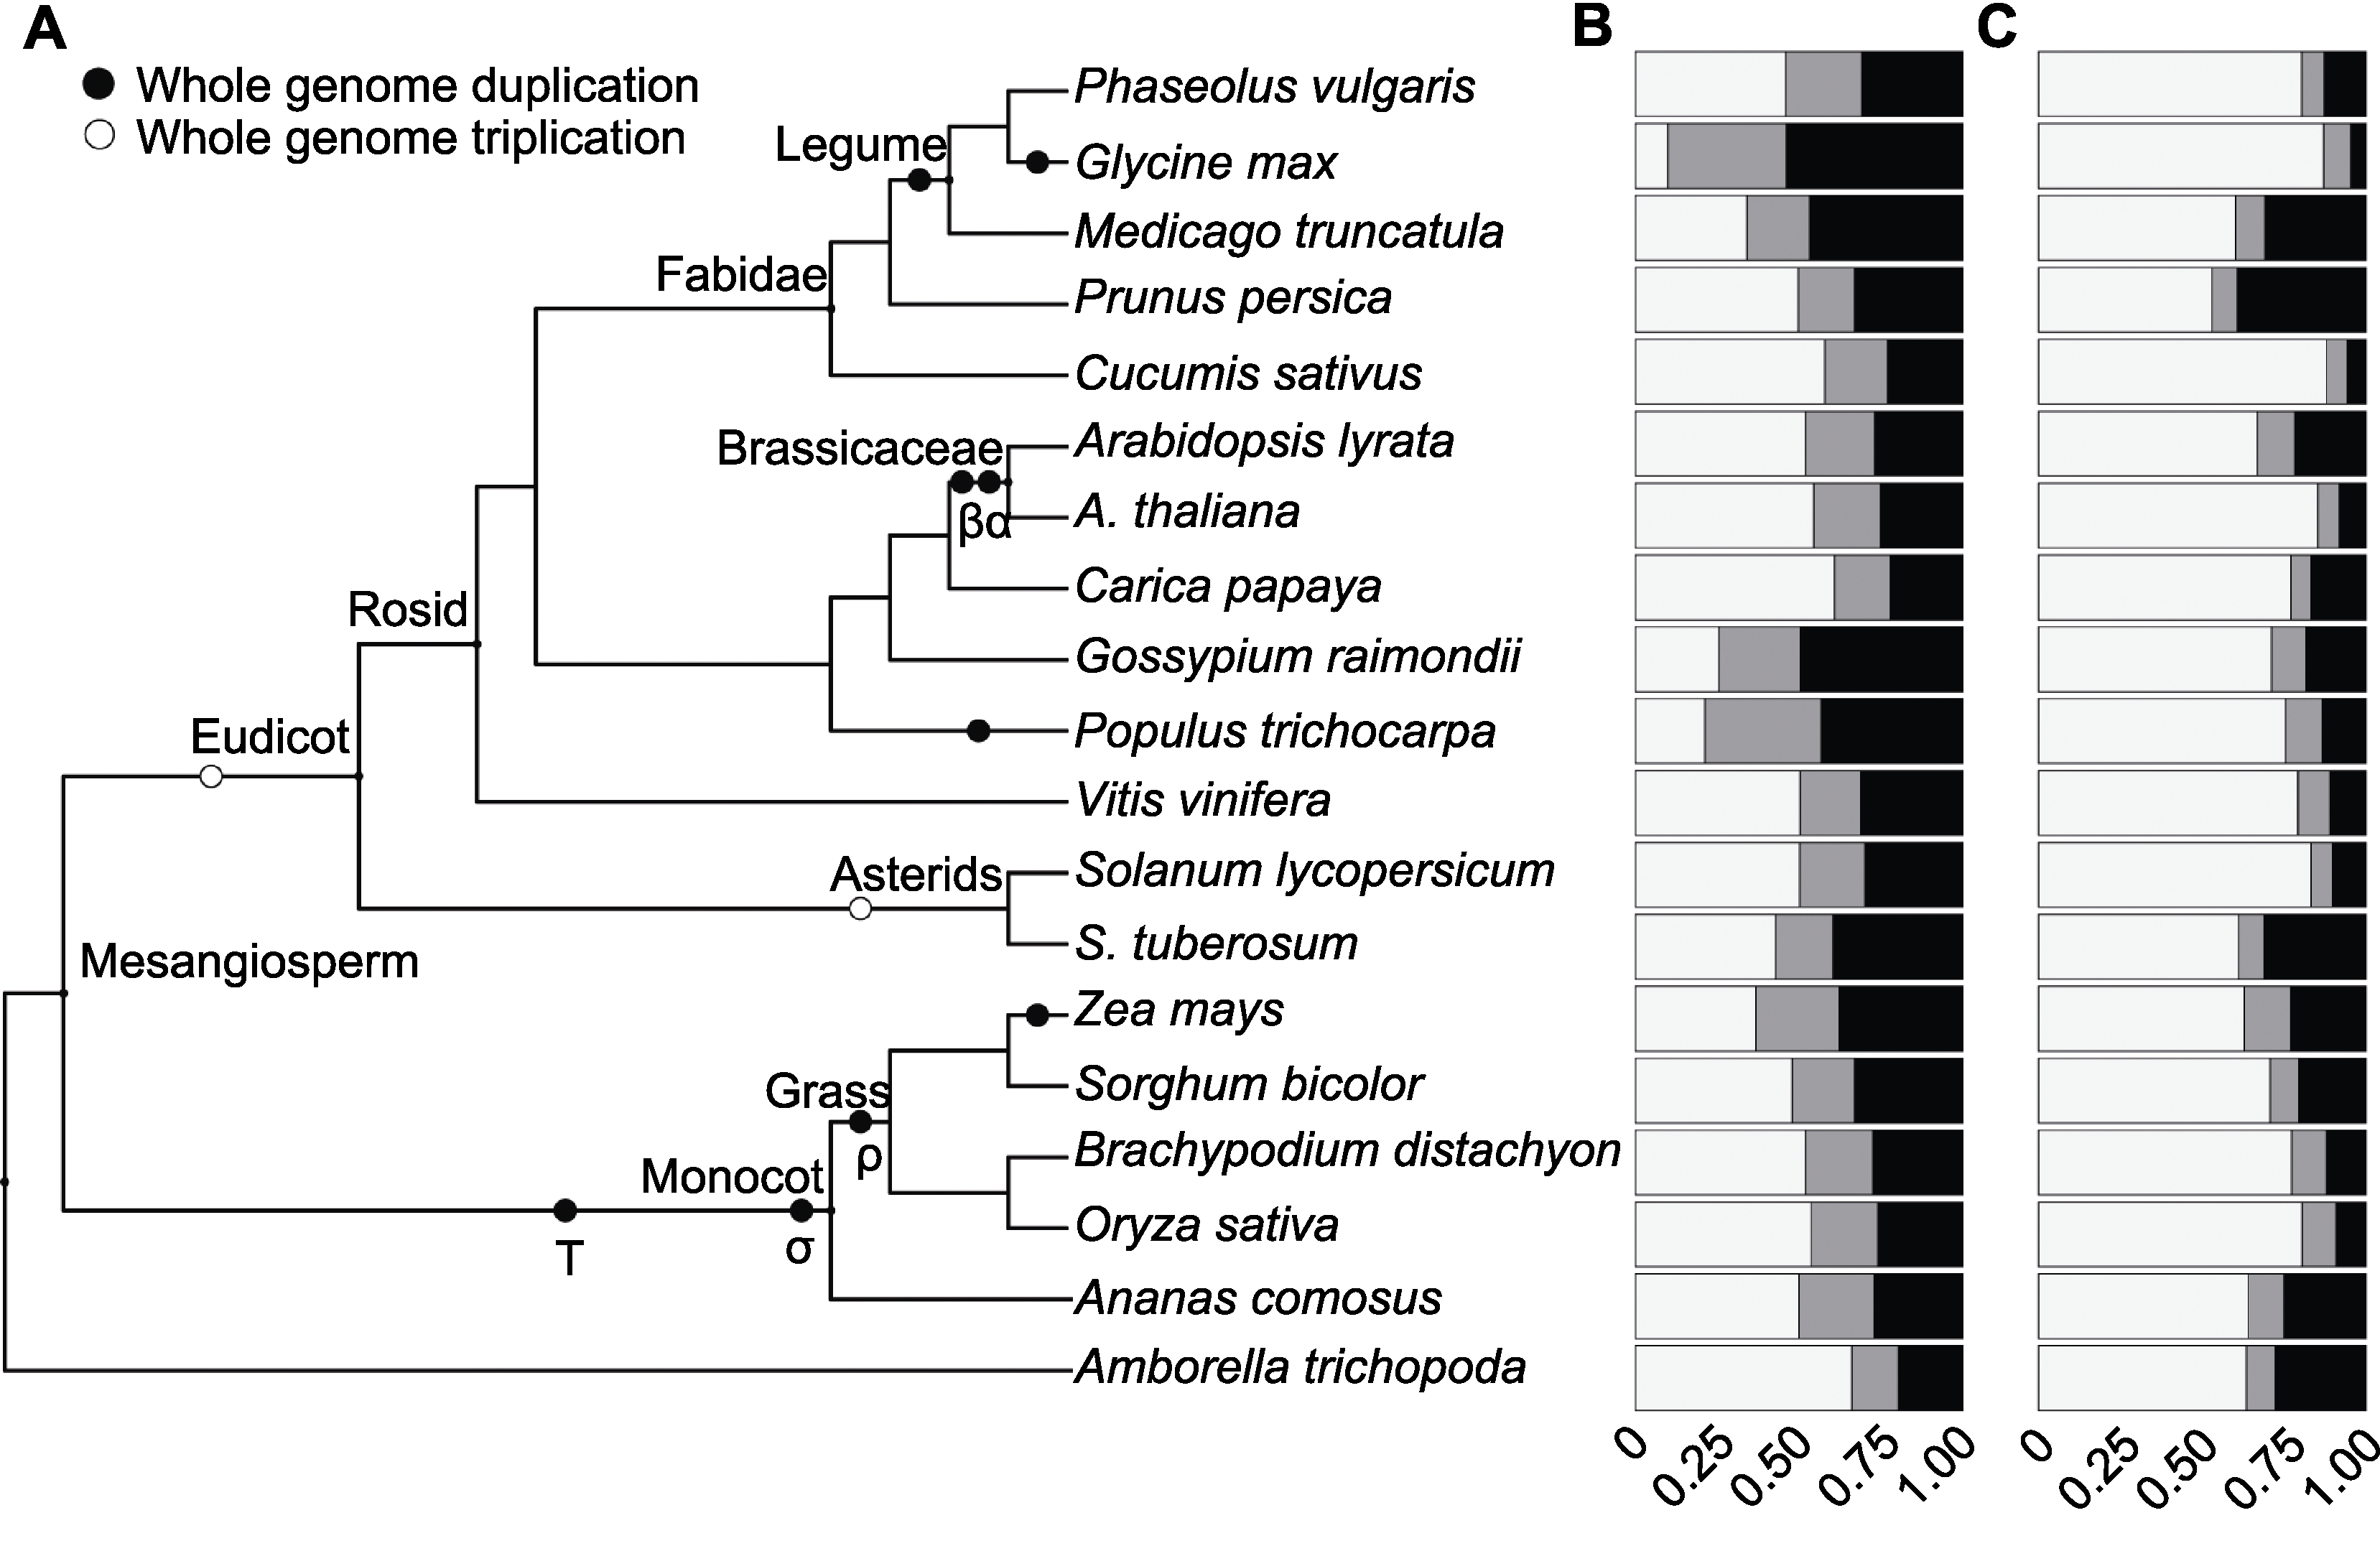
图1. 19种被子植物基因家族大小分布
(A) 系统发育树代
Figure 1. Gene family size distribution of 19 angiosperm species
(A) Phylogenetic tree showing the relationships between the 19 angiosperm species used in this study; (B) Homologous gene family sizes; (C) Gene family sizes of orphan genes. The colors indicate the proportions of genes, white for singletons, grey for two-genes and black for multigenes.