霜冻过程温光因子分析及模拟霜冻条件的建立
孙鲁龙1,2,段秋艳3,翟衡1,*( ),杜远鹏1,*()
),杜远鹏1,*()
Analysis of Temperature and Light Factors during Frost Events and Establishing Conditions for Simulated Frost
Lulong Sun1,2,Qiuyan Duan3,Heng Zhai1,*(),Yuanpeng Du1,*()
),Yuanpeng Du1,*()
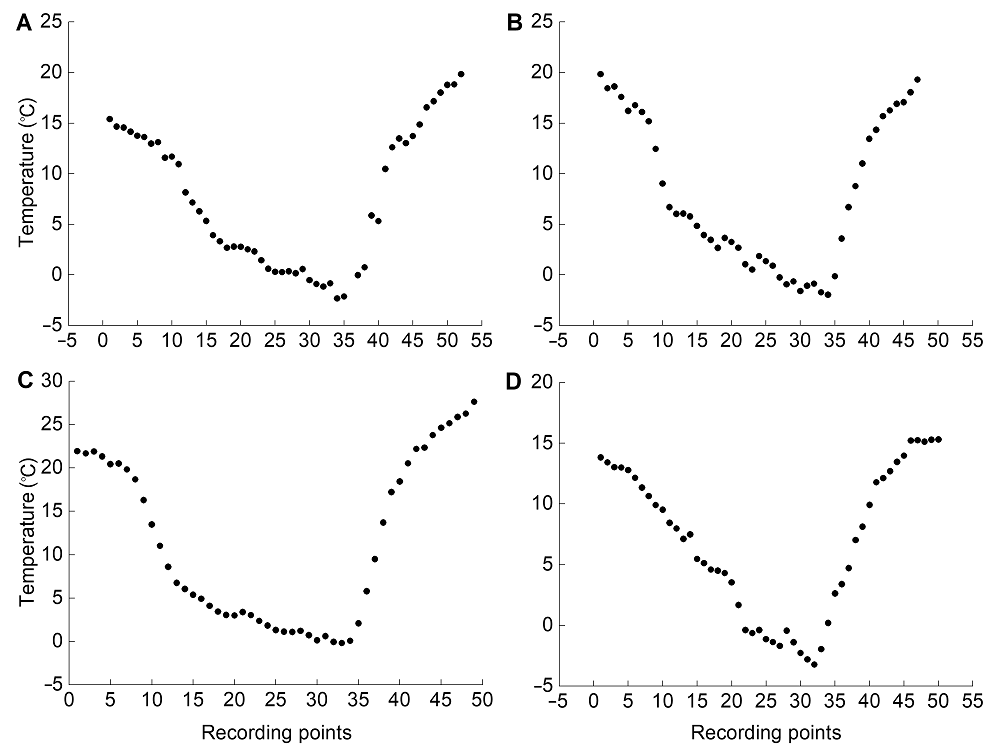
图1. 4次田间霜冻过程中气温的变化
(A) 2015-04-06-07; (B) 2015-04-07-08; (C) 2015-04-09-10; (D) 2016-03-13-14。气温的监测从霜冻前的最高气温开始到霜冻后最高气温结束, 气温记录时间间隔为0.5小时。横坐标0代表的时刻: 12:17 (A), 13:47 (B),13:47 (C), 14:55 (D)
Figure 1. Volatility of temperature during 4 frost events under field conditions
(A) 2015-04-06-07; (B) 2015-04-07-08; (C) 2015-04-09-10; (D) 2016-03-13-14. The temperature of air was recorded from the maximum temperature before frost events to the maximum temperature after frost events, the interval between each recording point was set to 0.5 h. The time of 0 in x-axis: 12:17 (A), 13:47 (B), 13:47 (C), 14:55 (D)