水稻响应缺铁的韧皮部汁液蛋白质组学分析
陈琳,林焱,陈鹏飞,王绍华,丁艳锋( )
)
)
Effect of Iron Deficiency on the Protein Profile of Rice (Oryza sativa) Phloem Sap
Lin Chen,Yan Lin,Pengfei Chen,Shaohua Wang,Yanfeng Ding()
)
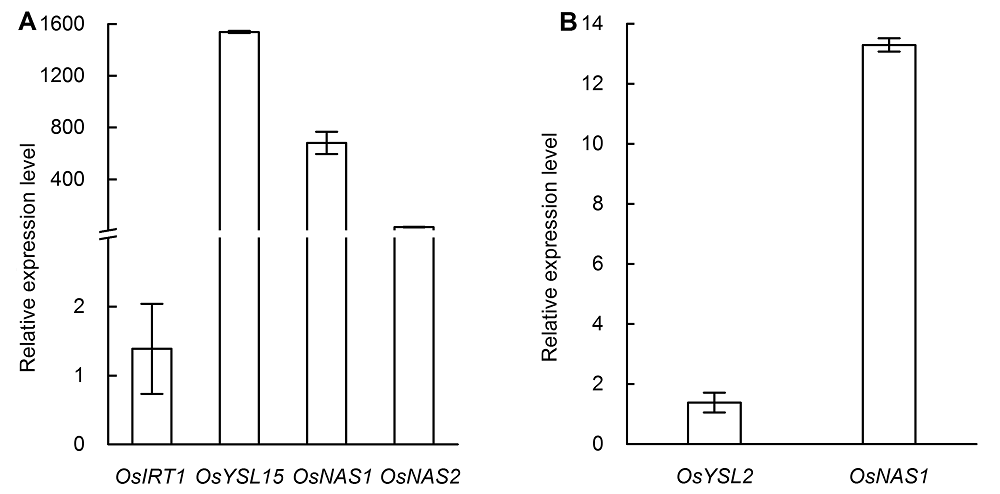
图5. 水稻缺铁处理3天后根系OsIRT1、OsYSL15、OsNAS1和OsNAS2 (A)以及地上部OsYSL2和OsNAS1 (B)相对表达水平
柱形图代表缺铁与对照基因相对表达量的比值。
Figure 5. The relative expression levels of OsIRT1, OsYSL15, OsNAS1 and OsNAS2 in root (A) and the relative expression levels of OsYSL2 and OsNAS1 in shoot (B) after three days of iron deficiency treatment
The column diagram represents the relative gene expression level ratio of iron deficiency induced to the control.