水稻响应缺铁的韧皮部汁液蛋白质组学分析
陈琳,林焱,陈鹏飞,王绍华,丁艳锋( )
)
)
Effect of Iron Deficiency on the Protein Profile of Rice (Oryza sativa) Phloem Sap
Lin Chen,Yan Lin,Pengfei Chen,Shaohua Wang,Yanfeng Ding()
)
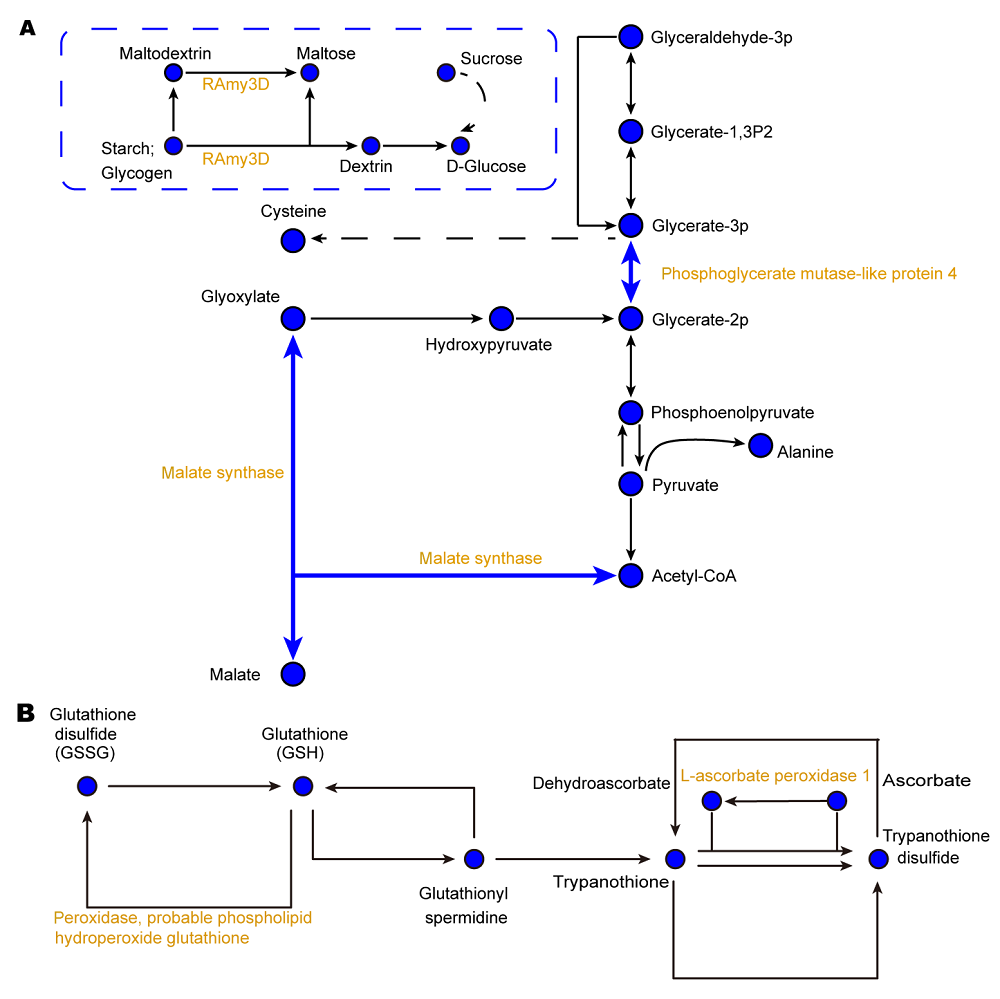
图4. 缺铁条件下水稻韧皮部汁液碳代谢(A)和谷胱甘肽代谢(B)相关蛋白质丰度变化示意图
黄色表示蛋白丰度下调。实线表示直接作用, 虚线表示中间有省略过程。箭头表示促进作用(正效应)。
Figure 4. Metabolic pathways of carbon (A) and glutathione (B) related proteins in phloem exudates of rice under iron deficiency
Yellow represents a decrease of protein expression abundance. The solid lines indicate direct action and the dotted lines indicate omission process. The arrows mean a positive effect.